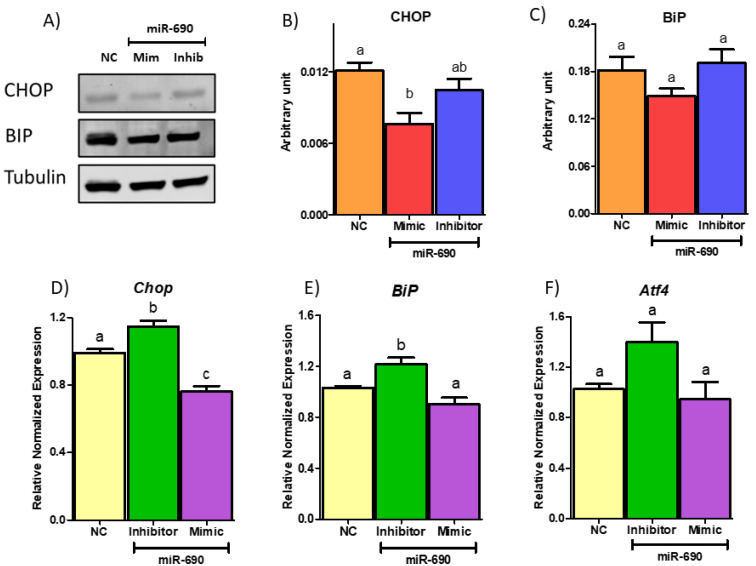
Figure 9.
Effects of targeting mitogen-activated protein kinase kinase 3 (Map2k3) by miR-690 on ER stress markers. (A) Western blot image of protein amounts of C/EBP homologous protein (CHOP) and binding immunoglobulin protein (BIP). Mir-690 Mimic significantly reduced CHOP expression compared to negative control (NC) group, but no changes were observed with inhibitor. BIP protein amounts were unchanged among NC, miR-690 mimic and inhibitor groups. (B) Quantification of CHOP protein normalized to Tubulin. (C) Quantification of BIP protein normalized to Tubulin. (D) Gene expression of Chop. miR-690 inhibitor significantly induced Chop expression, whereas mimic treatment reduced Chop expression as expected compared to NC group. (E) miR-690 inhibitor treated group had significantly increased mRNA level of BiP compared to NC group, yet no changes were observed among mimic and NC treated groups (F) No differences were observed in activating transcription factor 4 (Aft4) gene expression with treatments of miR-690 inhibitor or mimic compared to NC group. Common letters on the error bars indicate no significance (e.g., “a” is significantly different from “b” and “ab” indicates no significance compared to “a” and “b”). Data are presented as mean ± SEM (p < 0.05). (n = 4).

