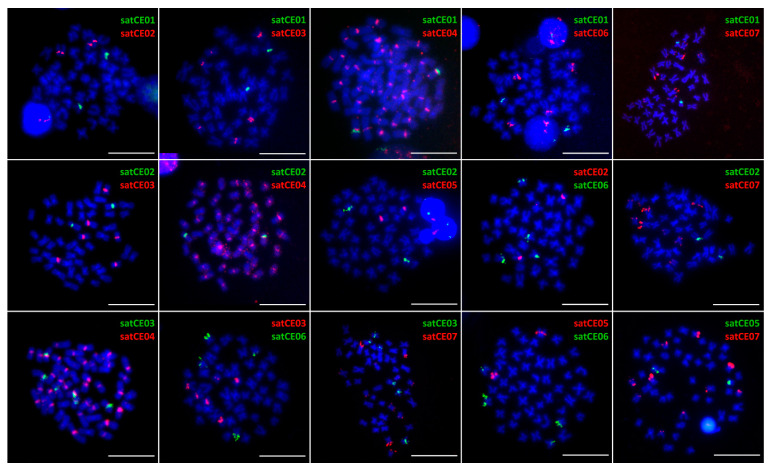
Figure 2.
Mapping of satDNA markers on metaphase chromosomes of C. elongatoides. Representative mitotic metaphases after double-colored FISH showing positions of satellites satCE01–satCE07 on chromosomes. SatCE02, satCE03, satCE06, and satCE07 show an interspecific polymorphism in the number of detected signals in C. elongatoides. Bars equal 10 µM.

