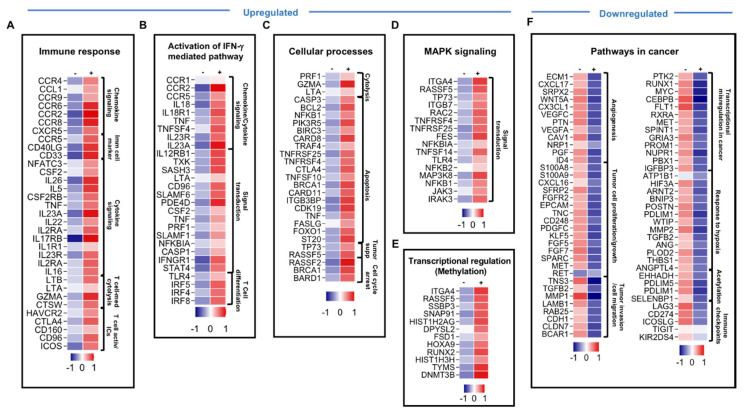
Figure 2.
Differential gene expression of breast tumor-infiltrating immune cells in response to pembrolizumab treatment. Heatmaps show the Z-score calculated from the transcript per million (TPM) of each gene to compare the expression level in tumor-infiltrating immune cells treated with anti-PD-1 vs. non-treated cells. Each column represents a sample pooled from two explant cultures either treated or untreated, and each row represents the Z-score for mean expression obtained from two explant cultures (patients #57 and 59). The Z-score for mean expression level of each gene is depicted according to color scale. The functional categorization of top significantly upregulated and downregulated genes (with a fold change of >2 and p value <0.05 cutoffs) from CLC analysis were analyzed separately through DAVID platform. Genes involved in immune response (A), the activation of the IFN-γ-mediated signaling pathway (B), cellular processes (C), MAPK signaling (D), and genes related to transcriptional regulation via methylation (E) were upregulated in response to anti-PD-1, while genes in cancer-related pathways (F) were downregulated.

