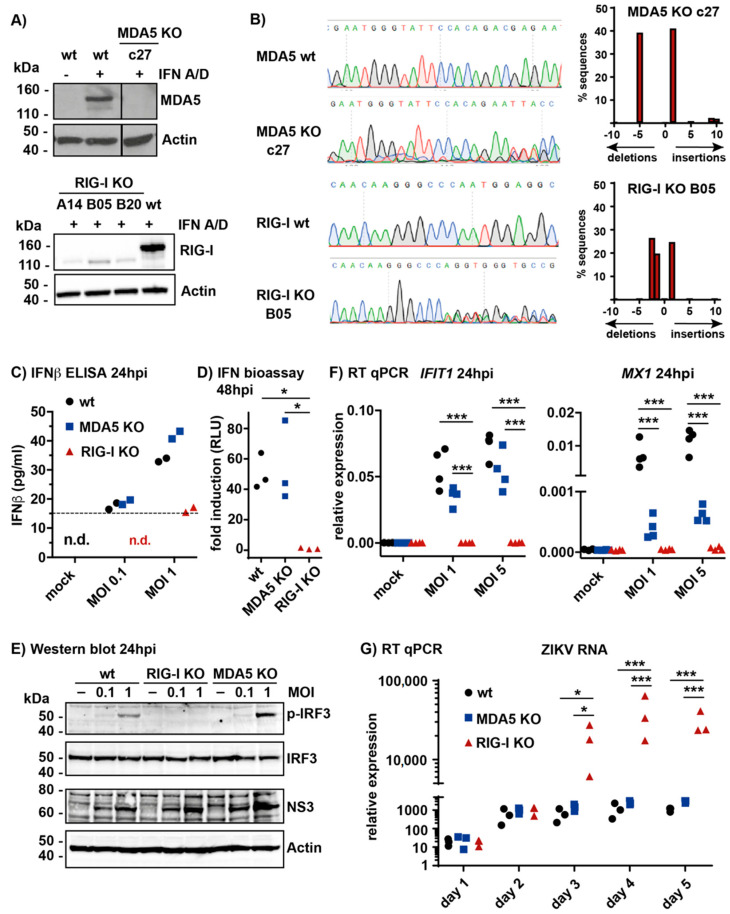
Figure 1.
Retinoic acid-inducible gene I (RIG-I) is the main sensor for Zika virus (ZIKV) infection in A549 cells. (A) A549 cells were knocked-out for melanoma differentiation-associated gene 5 (MDA5) or RIG-I as described in Materials and Methods. Cells were stimulated with recombinant type I IFN (IFN-A/D) to induce MDA5 and RIG-I to detectable levels and lysates were analyzed by western blot using the indicated antibodies. Actin served as a loading control. The vertical line indicates a cut combining two parts of the same blot. c27, A14, B05 and B20 are individual clones. wt, wild type; (B) Genomic DNA was extracted from MDA5 KO clone c27 or RIG-I KO clone B05 cells. A fragment of DNA surrounding the targeted area was amplified by PCR and sequenced (left). Sequences were analyzed using TIDE (right). The number of nucleotides inserted or deleted, and the percentage of sequences affected are shown; (C) A549 MDA5 KO or RIG-I KO cells (clone B05) were infected with ZIKV (MOI 0.1 or 1), supernatant was collected 24 h later and IFNβ levels were analyzed by ELISA. The horizontal dashed line indicates the detection limit; n.d., not detectable; (D) A549 cells were infected with ZIKV (MOI 1) and supernatant was collected 48 h later. HEK293 cells stably expressing the pGF1-ISRE reporter were incubated with the supernatant and F-Luc activity was measured after 24 h. Shown is the fold induction relative to supernatant from mock infected cells. (E) A549 cells were infected with ZIKV (MOI 0.1 or 1), protein samples were collected 24 h later and analyzed by western blot using the indicated antibodies. Actin served as a loading control; (F) A549 cells were infected with ZIKV (MOI 1 or 5) and RNA was isolated 24 h later. Levels of IFIT1 and MX1 mRNAs were determined with RT-qPCR and CT values normalized to GAPDH; (G) A549 cells were infected with ZIKV (MOI 0.1) and RNA was isolated at the indicated time points. RT-qPCR was performed and ZIKV RNA levels are presented relative to GAPDH. Data in A, C and E are representative of two independent experiments. Data in D, F and G are pooled from three (D,G) and four (F) independent experiments. Each data point is the mean value of two technical replicates. Statistical analysis: One-way (D) and two-way (F,G) ANOVA with Tukey’s multiple comparison (* p < 0.05, *** p < 0.001).

