
FIGURE 2.
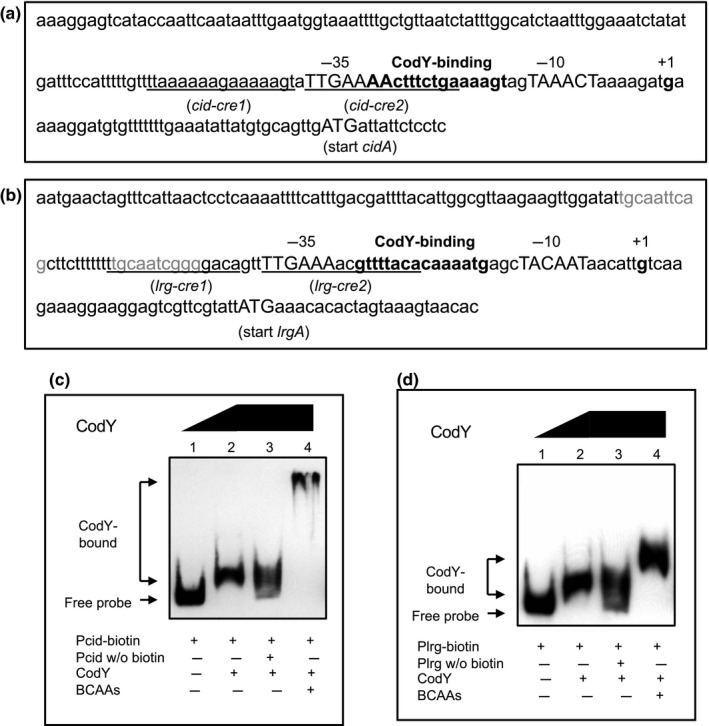
Potential binding site and activity of CodY in the cid and lrg promoters. a, b; The promoter regions of cid (a) and lrg (b). The potential CodY‐binding sites are displayed in bold font. The transcriptional start sites (TSSs) are numerically denoted (+1) in bold font, and −10/−35 sequences indicated by capital letters. The hypothetical cre sites are underlined. Predicted LytT DNA‐binding motif in the lrg promoter region is indicated in gray font. c, d; Electrophoretic mobility shift assays (EMSAs) of CodY binding with the promoter region of cid (c) or lrg (d). Biotin‐labeled promoter regions (4 fmol) of cid (a) and lrg (b) were incubated with the increasing amount of purified His‐CodY protein (0 and 25 pmol). Unlabeled promoter regions (0.3 pmol; lane 3) or BCAAs (10 mM; lane 4) were added in the binding reaction mixture, respectively. The reactions were run on a non‐denaturing polyacrylamide gel and the signal observed via chemiluminescence