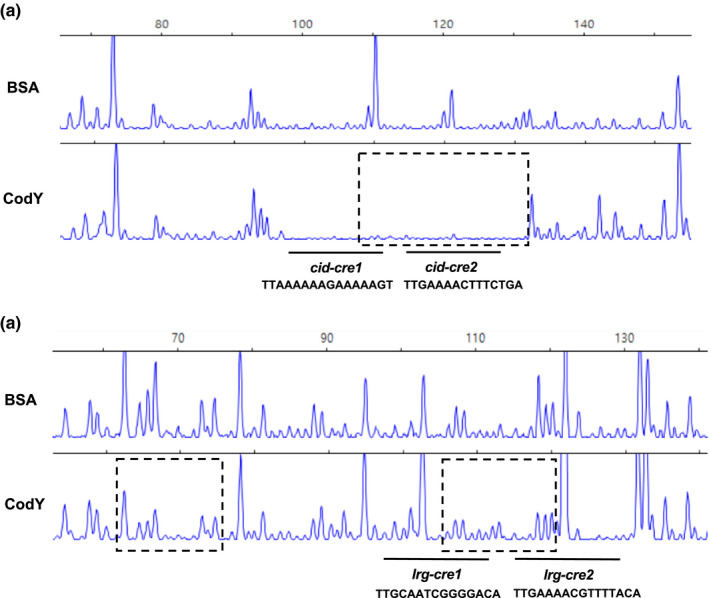
FIGURE 3.

DNase I footprinting assays of CodY binding to the cid and lrg promoter regions. Dotted boxes depict the regions protected from DNase I digestion upstream of cid (a) and lrg (b) by CodY. The electropherograms represent control DNA with BSA (bovine serum albumin) on top and footprints with of CodY in the bottom of each panel
