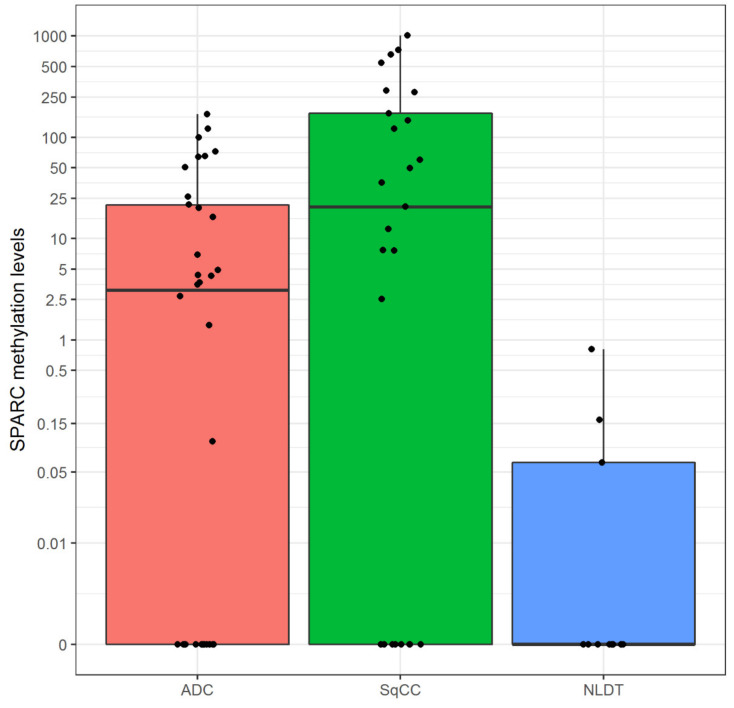
Figure 3.
Boxplots of global SPARC promoter methylation among the three phonotypical groups (pink for ADC, green for SqCC and blue for NLDT). The following five number summaries were reported into each box plot: minimum, first quartile, median, third quartile, and maximum. The central rectangle spans the first quartile to the third quartile (i.e., the interquartile range or IQR). The segment inside the rectangle shows the median and “whiskers” (above and below each box) show the locations of the minimum and maximum.

