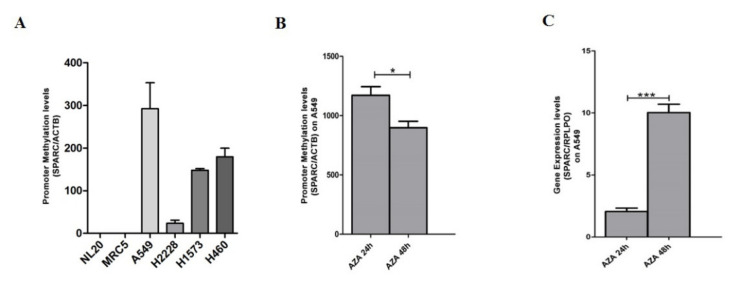
Figure 4.
(A) Representative QMSP analysis showing the comparison between the promoter methylation levels of SPARC in NSCLC cell lines (A549, H2228, H1573, H460). Two normal lung cell lines NL20 and MRC-5 were used as negative controls. Changes in (B) SPARC promoter methylation levels detected by QMSP and (C) SPARC mRNA transcript levels by quantitative real-time (RT-qPCR) in the A549 cell line before and after treatment with 5µm of 5-azacytidine (5-aza-Dc, AZA) at 24 (AZA 24 h) and 48 h (AZA 48 h). Error bars indicate the standard deviation of three different experiments. * p < 0.05, *** p < 0.001 (t-test).

