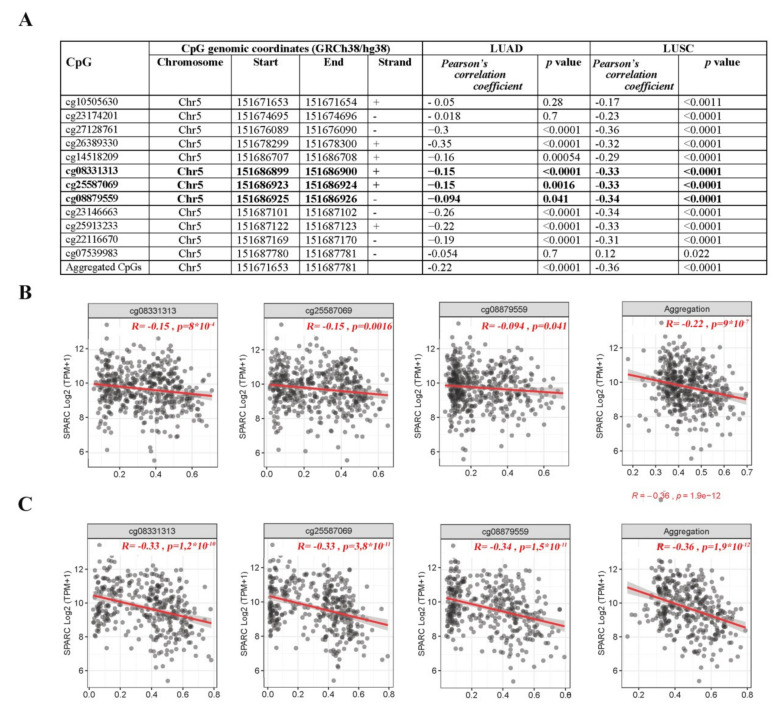
Figure 7.
Correlation analysis between SPARC methylation (450 K BeadChip array, Beta-values) and expression (RNA-Seq, Transcripts per million, TPM-normalized read counts) values from TCGA-LUAD and TCGA-LUSC datasets. (A) Probes ID, chromosomal location, Pearson’s correlation coefficient and significance level. Bold lines refer to the three CpGs located in the SPARC island included in the QMSP assay. Scatter plots between β-values (x-axis) and expression values of SPARC in (B) LUAD and (C) LUSC TCGA datasets and concerning the CpGs located in the promoter region subjected to QMSP analysis in our study cohort.

