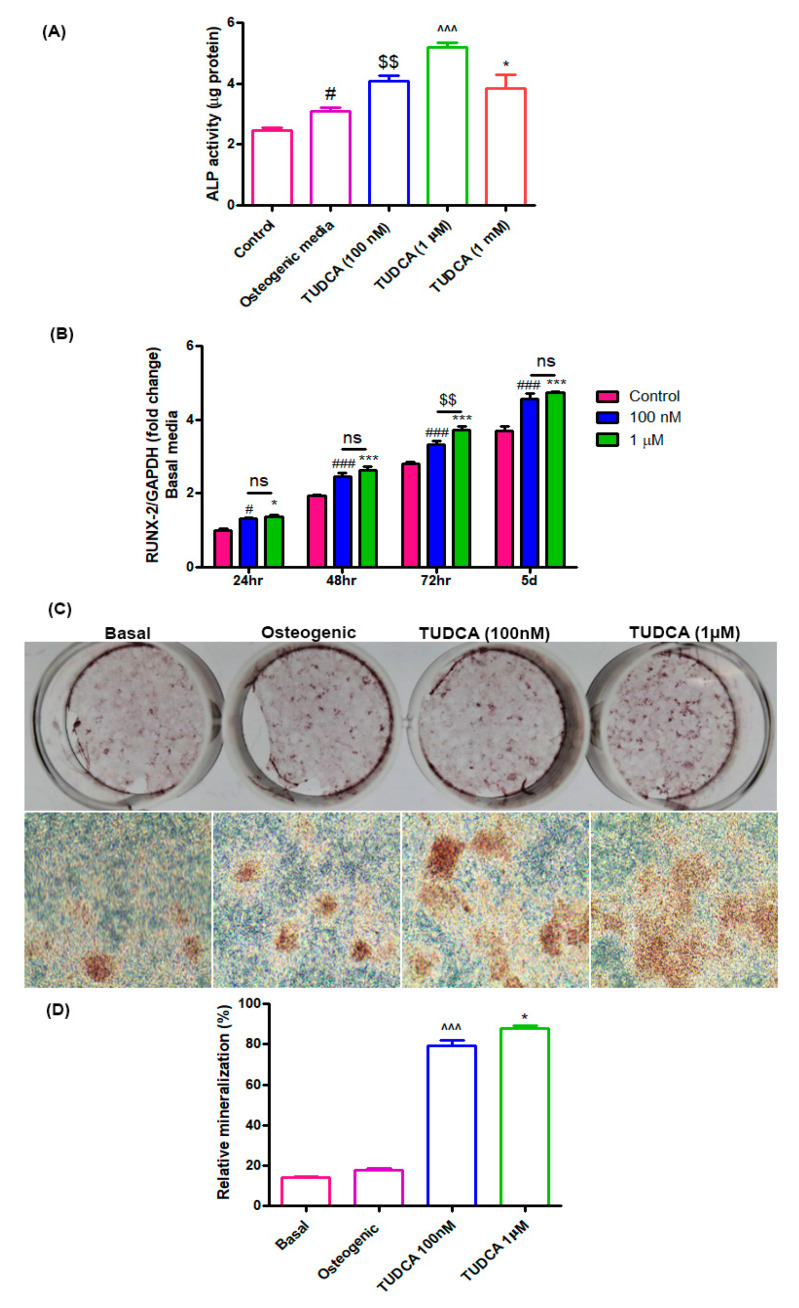
Figure 2.
Effect of TUDCA on osteoblast differentiation. (A) Alkaline phosphatase activity assay for control, 100 nM, 1 µM, and 1 mM TUDCA on day 5, showing higher values in the 100 nM and 1 µM TUDCA cohort. Means ± SEM, # p < 0.05 (Osteogenic media vs. control), $$ p < 0.01 (TUDCA-100 nM vs. Osteogenic media), ^^^ p < 0.001 (TUDCA-1 µM vs. TUDCA-100 nM), *** p < 0.001 (TUDCA-1 mM vs. TUDCA-1 µM) (B) The expression of RUNX2 gene increased in the 100 nM and 1 µM TUDCA cohort. Means ± SEM, ### p < 0.001 (48 h vs. 24 h), ^^^ p < 0.001 (72 h vs. 48 h), *** p < 0.001 (5 d vs. 72 h) (C) Representative images of Alizarin Red-S staining on day 14 for different culture conditions: controls, osteogenic media, 100 nM TUDCA, and 1 µM TUDCA. Higher mineralization was observed in the TUDCA treatment cohort. Scale bar, 100 µm. (D) Quantitative result showing relative mineralization. Means ± SEM, ^^^ p < 0.001 (TUDCA-100 nM µ vs. Osteogenic), * p < 0.05 (TUDCA-1 µM vs. TUDCA-100 mM).

