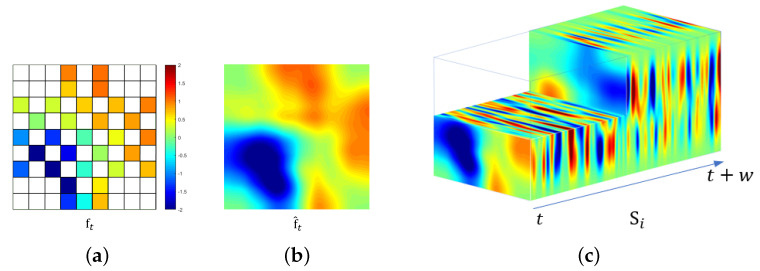
Figure 5.
Illustration of spatio-temporal conversion. (a) 2D representation of 1D raw EEG data at time t. (Empty values are represented as white.); (b) 2D EEG frame from sparse by interpolation; (c) 3D EEG stream with the length w. (Note that the front dashed part is intentionally expressed to show the middle row of the 3D EEG stream.)

