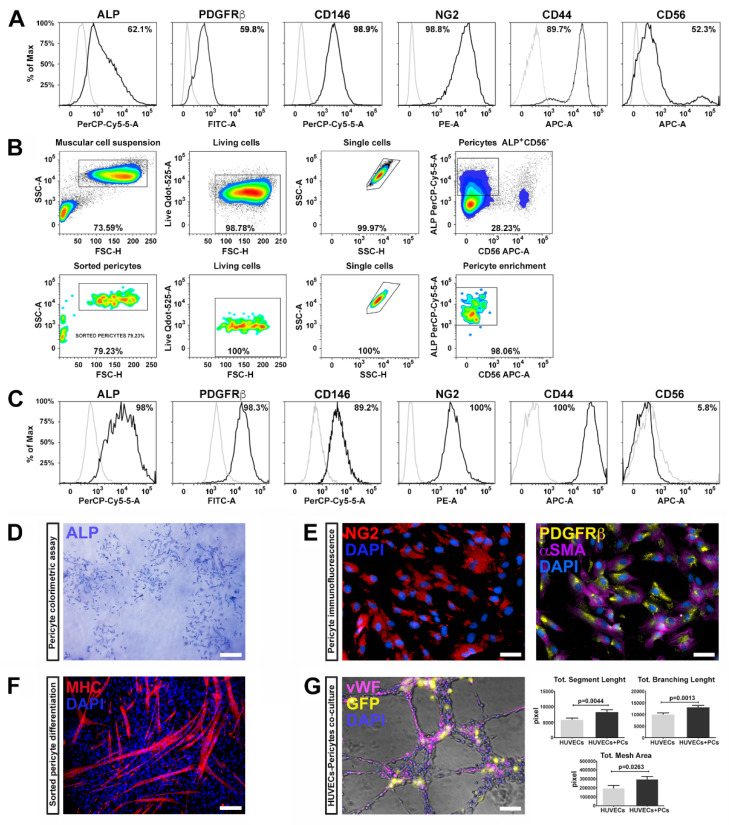
Figure 1.
Pericyte characterization. (A) Representative histograms indicating the percentage of alkaline phosphatase (ALP+), platelet derived growth factor receptor-beta (PDGFRβ+), MCAM, melanoma cell adhesion molecule (CD146+), (αSMA+), Neuron/glial antigen 2 (NG2+), HCAM, homing cell adhesion molecule (CD44+) and NCAM, neural-cell adhesion molecule (CD56+) positivity (black peaks) determined by flow cytometry in pre-sorted cells isolated from muscular biopsy (n = 4). Matched isotypes were used as negative controls (grey peaks). (B) Representative gating strategy for ALP+ and CD56− cell sorting (n = 3). Cells were first gated for cell size (side light scatter SSC-A vs. forward light scatter FSC-H) and vitality (Live Qdot-525-A). The muscular cell gate was further analyzed for singlets (SSC-A vs. SSC-H) and their expression for ALP and CD56. Pericytes, ALP+ and CD56− were then sorted from this gated population. The lower set of four plots confirmed the efficiency of the sorting. (C) Representative post-sorting histograms for key pericyte markers after two passages in vitro, indicating an enhanced expression of ALP, NG2, PDGFRβ, CD146, and CD44. (D) Sorted pericytes stained for ALP showing fibroblast colony-forming units (CFU-F) when seeded at low confluence. Scale bar represents 300 μm. (E) Immunofluorescence labeling for NG2 (red) and the co-staining for PDGFRβ (green) and αSMA (magenta) on sorted ALP+CD56− cells. Nuclei were stained with DAPI. Scale bar represents 50 μm. (F) Representative fluorescence image for myosin heavy chain (MHC) (red), validating the differentiation of sorted pericytes toward skeletal muscle phenotype. Scale bar represents 100 μm. (G) Illustrative images of human umbilical vein endothelial cells (HUVEC) in co-culture with pericytes displaying the formation of capillary-like networks with HUVEC labeled for von Willebrand factor (vWF; magenta), and GFP+ pericytes. Nuclei were identified by DAPI (blue). Scale bar represents 100 μm. Tubular structures were photographed at 5× magnification and quantified by the angiogenesis analyzer ImageJ tool. Total segment length, total mesh area and total branching length exhibited significant differences between HUVEC alone and in co-culture with pericytes, as shown in the graphs.

