Figure 3.
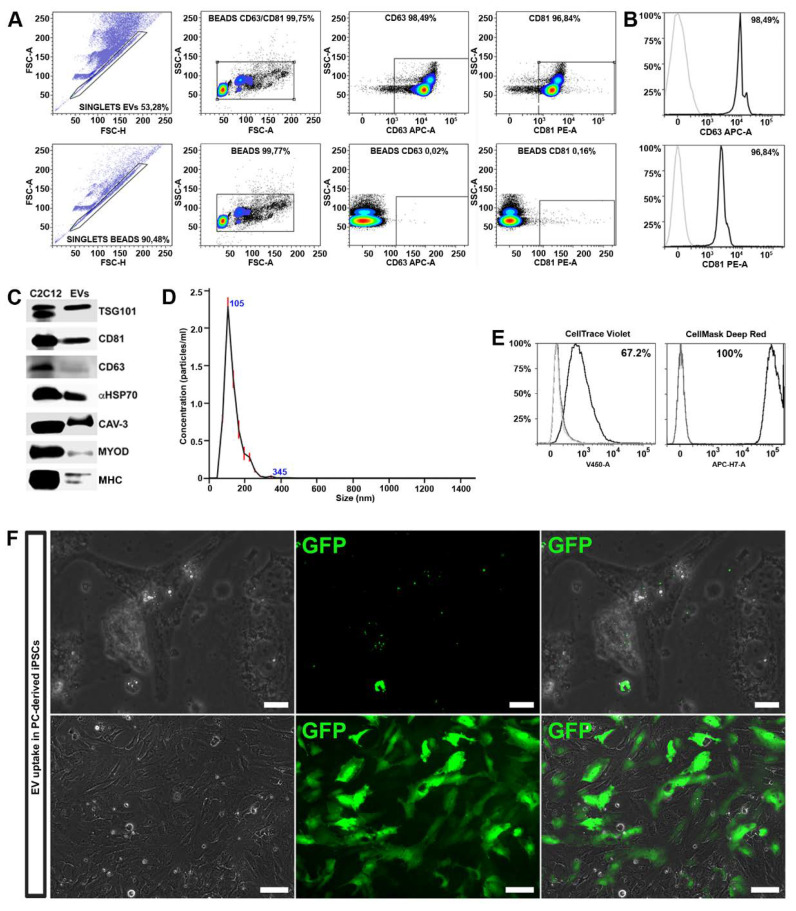
Extracellular vesicle (EV) characterization and uptake. (A) Sample gating strategy indicating the percentage of CD63+ and CD81+ in myotube (MT)-derived EVs coated with beads (n = 3). In the upper plots, singlets and subsequently EVs were selected according to physical parameters (FSC-A vs. FSC-H and SSC-A vs. FSC-A, respectively) are shown. Fluorescent intensity signal for CD63 and CD81 was detected on gated EVs (SSC-A vs. APC-A and SSC-A vs. PE-A, respectively). Beads alone were used as control (lower four scatter plots). (B) Representative histograms displaying the percentage of EV specific markers, such as CD81 and CD63, determined by flow cytometry in purified MT-derived EVs. Matched isotypes were used as negative controls (grey peaks) (C) Western blot for specific the expression of EV markers, such as TSG101, CD81, CD63, aHSP70, and skeletal muscle markers, such as CAV-3, MYOD, MHC, in C2C12-derived myotubes and C2C12 myotube-derived EV lysates. (D) Size distribution profile of MT-derived EVs (n = 5). (E) Representative histograms, determined by flow cytometry, displaying the percentage of positive cells (black) after the treatment with EVs stained for cell trace violet or cell mask deep red. Non-treated cells (light grey peaks) and cells treated with unstained EVs (dark grey peaks) were used as controls. (F) Green spots indicate the presence of fluorescent (GFP+) EVs, derived from GFP transduced myotubes, in the cytoplasm of the recipient differentiating iPSC after 48 h of exposure (upper panels; scale bars represent 20 μm); GFP+ cells 10 days after GFP+ MT-derived EV exposure (lower panels; scale bars represent 100 μm), demonstrating that GFP was transferred through the EVs into the recipient cells.

