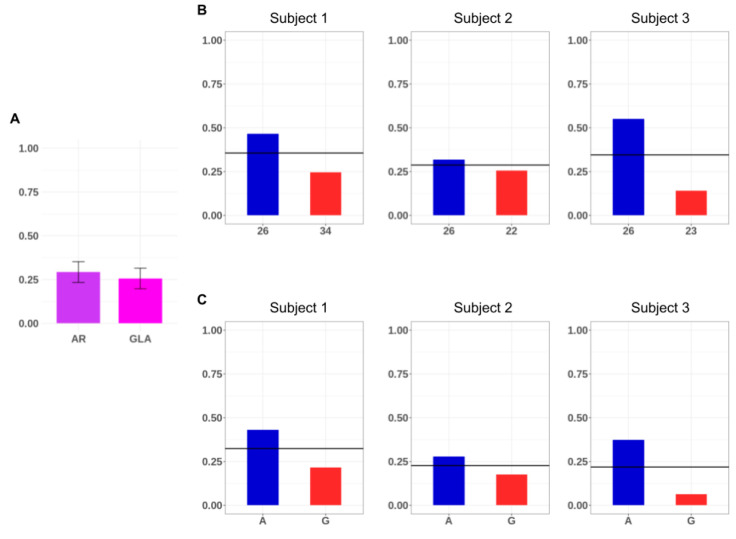
Figure 4.
Locus and allele-specific average DNA methylation of the analyzed regions. (A) Locus average DNA methylation of the AR and GLA analyzed regions in the three selected subjects. The bars indicate the standard deviation between the subjects. (B) Allele-specific DNA methylation of the androgen receptor (AR) for the three subjects. The paternal 26 allele is colored in blue; the maternal alleles (34 for subject 1, 22 for subject 2 and 23 for subject 3) are colored in red. (C) Allele-specific DNA methylation of the alpha galactosidase (GLA) amplicon for the three subjects. The paternal shared A allele is colored in blue, while the maternal G allele in blue. In (B) and (C) the AR and GLA locus average methylation value is indicated (horizontal black line).

