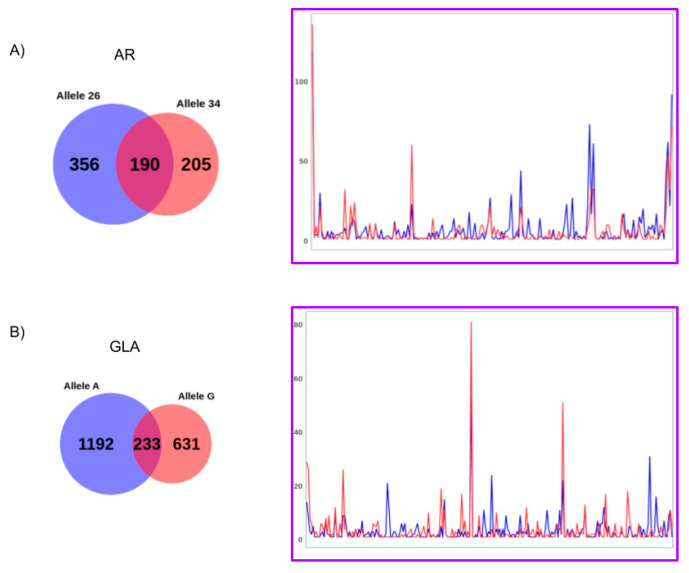
Figure 6.
Results of the epialleles analysis for the AR (A) and GLA (B) allelic sequences from subject 1. The Venn diagrams summarize the number of allele-specific (red and blue circles) and shared (purple circle) epialleles. For the shared epialleles (excluding the fully unmethylated epiallele), the allelic counts are shown (red and blue lines). The epialleles are ordered on the x-axis based on the increased number of methylated sites.

