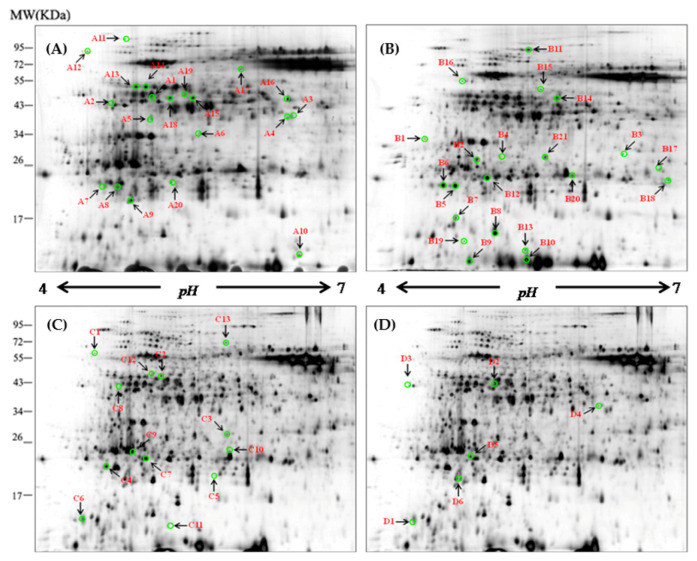
Figure 1.
Representative two-dimensional gel electrophoresis (2-DE) maps of barley leaf proteins in XZ5. The proteins were isolated from the leaf of XZ5 exposed to drought (A), salinity alone (B), and combined stress D+S [(D+S vs. D (C), D+S vs. S (D)] during the vegetative stage at the 4% soil moisture level. Each 150-µg protein sample in 0.8% (v/v) Immobilized pH Gradient (IPG) buffer (Amersham Biosciences) was loaded onto analytical gels for 2-D gel image analysis using the silver-staining method. The spots were visualized by silver staining. Differentially accumulated protein spots are indicated by green sashes. Arrows indicate the differentially expressed protein spots whose expression levels were significantly induced (fold change ≥ 1.5) or downregulated (fold change < −1.50) in XZ5. The numbered leaf protein spots were labeled A1–A20, B1–B21, C1–C13, and D1–D6.

