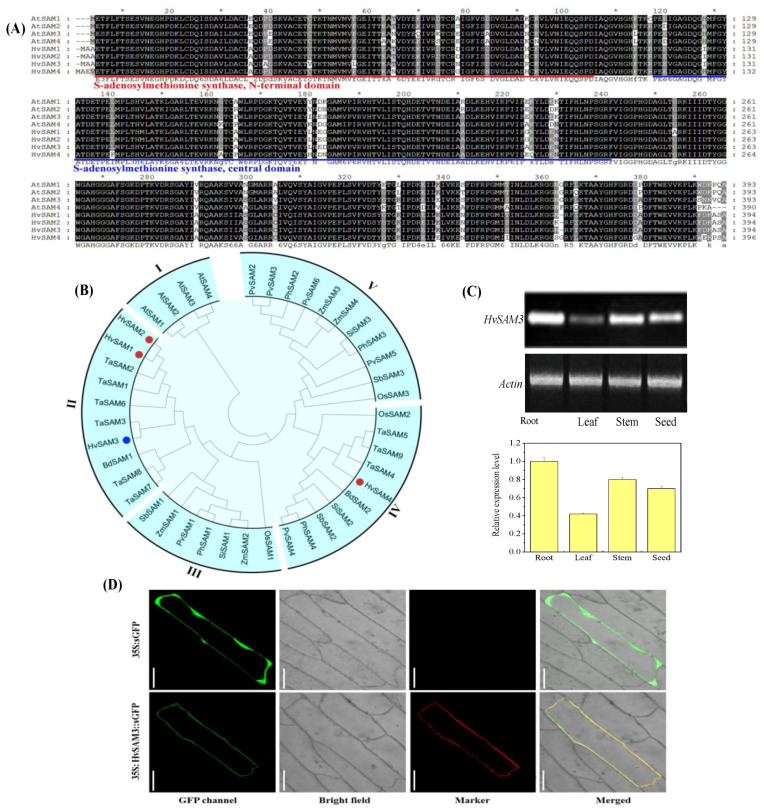
Figure 3.
Identification of S-adenosylmethionine synthetase (SAM) proteins in monocots. (A) Multiple alignment of amino acid sequences of AtSAM1–AtSAM4 and identification of SAM in barley (HvSAMS1–HvSAMS4). The conserved S-adenosylmethionine synthetase N-terminal domain and S-adenosylmethionine synthetase central domain are shown. (B) Phylogenetic analysis of SAM proteins in monocots. The colored dots symbolize SAM members in barley. Tissue expression pattern and subcellular localization of S-adenosylmethionine Synthetase 3 (HvSAMS3). (C) RT-PCR analysis of the relative transcript levels of HvSAMS3 in different tissues of XZ5. (D) Transient expression of GFP (Green fluorescent protein) and the HvSAMS3-sGFP fusion protein in onion epidermis cells. Images are GFP fluorescence (GFP; green pseudocolor), red fluorescence [RFP PM marker (plasma membrane-localized marker); red pseudocolor], optical photomicrographs (bright field), and merged (optical photomicrographs, RFP PM marker, and GFP fluorescence). The data shown are representative of three independent experiments (n = 3). Scale bars, 100 μ.

