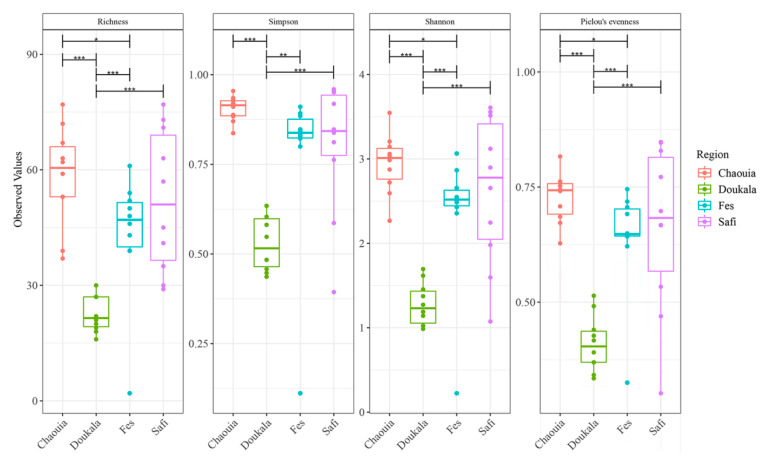
Figure 2.
Species richness and diversity indices with significance differences of Hessian fly samples collected from Chaouia, Doukkala, Fes and Safi regions. Boxes represent inter-quartile range (IQR), the line within the boxes is the median, and the dots represent samples. * p < 0.05, ** p < 0.01 and *** p < 0.001.

