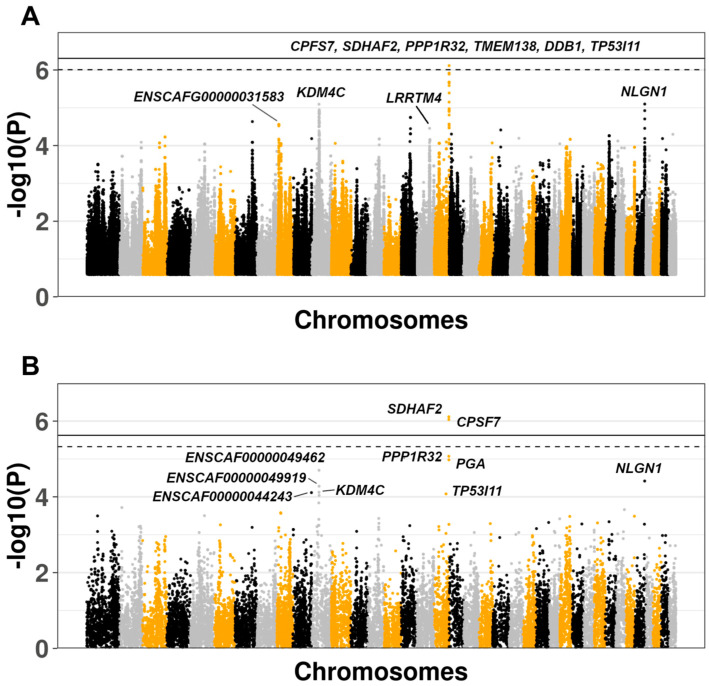
Figure 1.
(A) SNP level analysis: Manhattan plot of the top 500K SNPs ranked by unadjusted p-value. The continuous and dashed lines indicate the genome-wide (p < 4.91 × 10⁻⁷) and suggestive (p < 9.83 × 10⁻⁷) significance thresholds, respectively. The p-value adjustment was conducted using the Bonferroni method, accounting for 101,740 independent SNPs estimated using regional linkage disequilibrium (LD) patterns. Gene names reported are the top 10 according to the SNP level analysis. (B) Gene level analysis: Manhattan plot of all the genes ranked by p-value. The continuous and dashed lines indicate the genome-wide and suggestive significance thresholds, respectively. The adjustment was conducted using the Bonferroni method accounting for the total number of genes tested (n = 18,110). Gene names reported are the top 10 according the gene level analysis.

