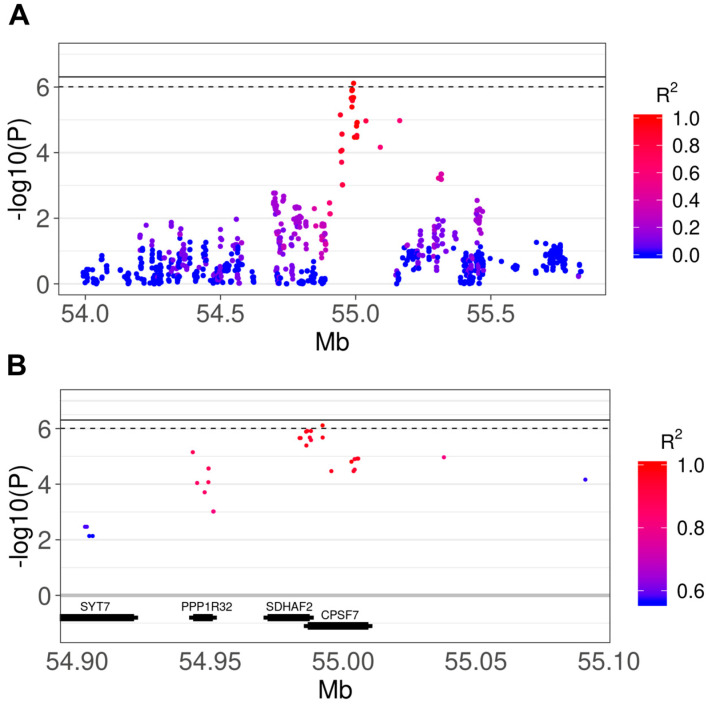
Figure 2.
Manhattan plots showing the details of the association region in chromosome 18. The continuous and dashed lines indicate the genome-wide and suggestive significance thresholds, respectively. The color of the points indicates the LD (expressed as R2) between the top (rs22669389) and the close SNPs. Values of R2 range from 0 (absence of LD) to 1 (complete LD). Figure 2B shows a smaller R2 range due to the closeness of the top SNP. (A) Region ± 1 Mb from the top SNP; (B) region ± 0.1 Mb from the top SNP. Thick sections of the genes represent the actual gene region according to Ensemble, the thin sections represent the surrounding regions (± 1500).

