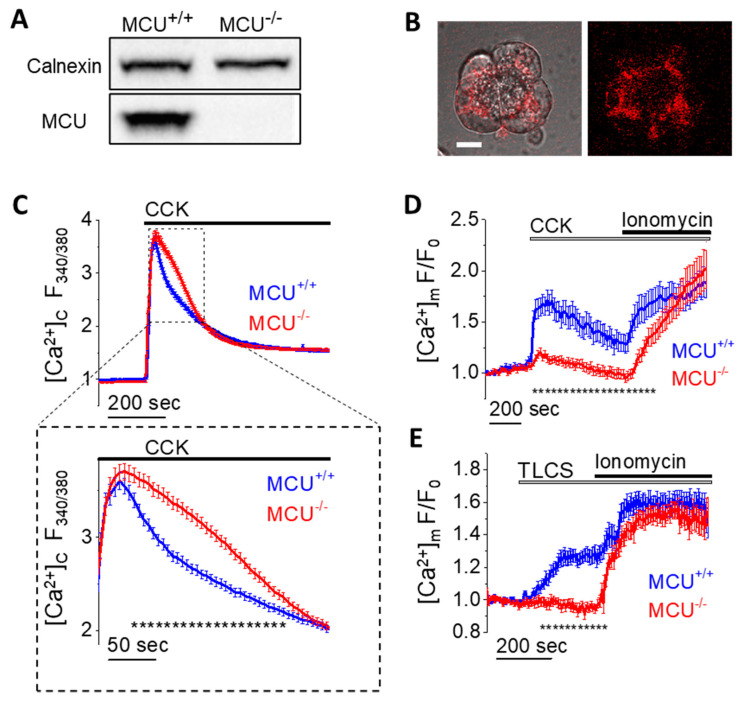
Figure 1.
Cytosolic and mitochondrial Ca2+ signaling in pancreatic acinar cells from MCU−/− and WT (MCU+/+) mice. (A) Western blot analysis of MCU in pancreata isolated from MCU−/− and MCU+/+ mice. The complete Western blot associated with this figure is shown in Figure S1A. (B) Images of MtRCaMP in a small cluster of WT pancreatic acinar cells showing a typical mitochondrial distribution (e.g., [11]). The right panel shows the distribution of fluorescence. The left panel shows the overlay of transmitted light and fluorescence. Scale bar represents 10 µm. A similar distribution was observed in the acinar cells from MCU−/− mice (Figure S1B). (C) [Ca2+]C responses (measured with fura-2 (loaded in fura-2 AM form), 340 nm:380 nm ratio) to 1 nM CCK in pancreatic acinar cells isolated from MCU−/− mice (n = 286 cells, N = 4 mice) and MCU+/+ mice (n = 197 cells, N = 4 mice). The expanded fragment (lower panel in (C)) highlights the period of [Ca2+]C responses in which there were significant differences between measurements conducted on acinar cells isolated from MCU−/− mice and MCU+/+ mice. Dotted line under the traces (composed of small asterisks) indicates the only period (from 55 to 215 s following CCK addition) when the measurements from MCU+/+ and MCU−/− cells were significantly different (p < 0.05). Here and in (D,E) data are presented as the mean value ± standard error of the mean. (D) [Ca2+]m responses to 1nM CCK followed by 20 µM Ionomycin/10 mM Ca2+ in pancreatic acinar cells isolated from MCU−/− mice (n = 53 cells, N = 5 mice) and MCU+/+ mice (n = 25 cells, N = 3 mice). Here and in (E) the traces show the fluorescence of MtRCaMP (F) normalized to its initial fluorescence (F0). Dotted line under the traces (composed of small asterisks) indicates the period (from 15 to 795 s following CCK addition) when the measurements from MCU+/+ and MCU−/− cells were significantly different (p < 0.05). (E) [Ca2+]m responses to 500 µM TLCS followed by 20 µM Ionomycin/10 mM CaCl2 in pancreatic acinar cells isolated from MCU−/− mice (n = 25 cells, N = 3 mice) and MCU+/+ mice (n = 22 cells, N = 3 mice). Dotted line under the traces (composed of small asterisks) indicates the period (from 77 to 320 s following TLCS addition) when the measurements from MCU+/+ and MCU−/− cells were significantly different (p < 0.05).

