Figure 3.
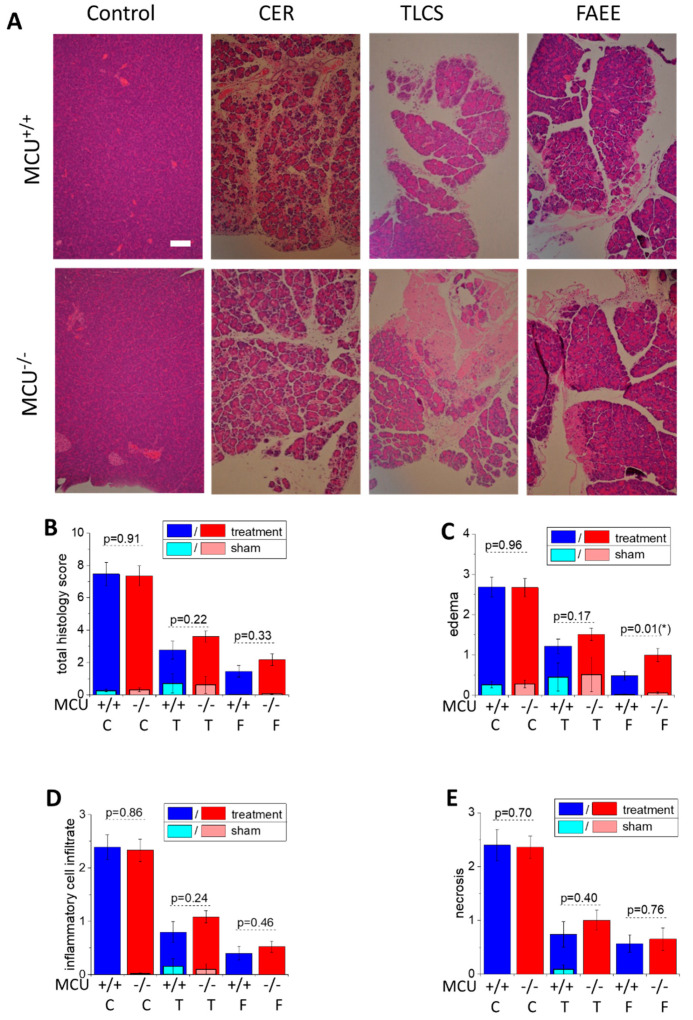
MCU knockout does not reduce histopathology scores in CER-AP, TLCS-AP and FAEE-AP. (A) Representative images of pancreatic sections demonstrating histopathology changes (hematoxylin and eosin staining; scale bar represents 100 µm). The models of AP are abbreviated on the graph as C for CER-AP, T for TLCS-AP and F for FAEE-AP. One representative control experiment (for CER-AP) is shown in this part of the figure; all saline controls had low total histopathology scores (see below). (B–E) The histopathology scores. The bars indicate the mean values ± the standard errors. In all parts of this figure, dark bars represent the treatment groups, while the light bars represent control (sham) groups (see Materials and Methods Section and text boxes above the bars specifying the color coding). There were no statistically significant differences between the control/sham groups of MCU−/− and MCU+/+ mice in the histopathology scores for any type of control/sham experiments (p > 0.05). The scores for all treatment groups were significantly different (p < 0.05) from the scores for the corresponding control (sham) groups. (B) The total histopathology score for MCU−/− and MCU+/+ mice. (C–E) The component scores: (C) edema (asterisk indicates p < 0.05); (D) inflammatory cell infiltration; and (E) necrosis. The p values for comparison between MCU−/− and MCU+/+ mice in AP models are indicated above the corresponding bars. In this part of the study, 12 MCU−/− and 13 MCU+/+ mice were used for the CER-AP; 7 MCU−/− and 10 MCU+/+ for the TLCS-AP; and 8 MCU−/− and 6 MCU+/+ for the FAEE-AP. Histopathological scores for AP induced in MCU−/− and MCU+/+ did not reveal significant differences except for edema in FAEE-AP, which had a higher score for MCU−/− (p = 0.01; marked with asterisk on the figure).

