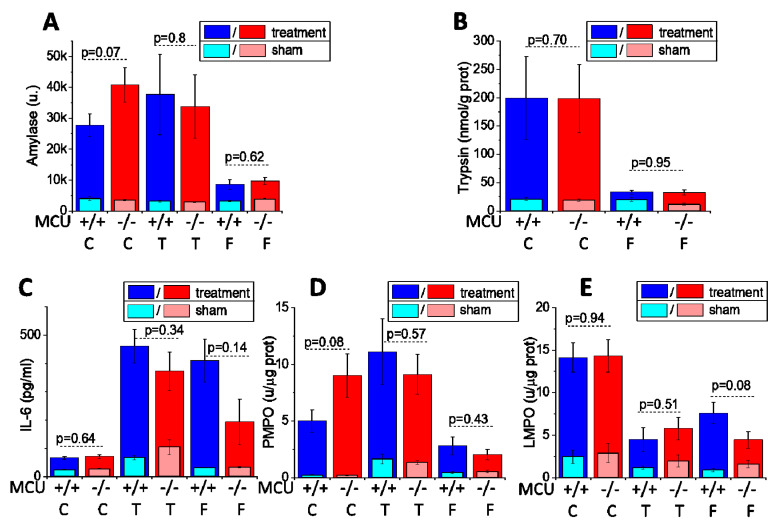
Figure 4.
MCU knockout does not reduce biochemical parameters characterizing the severity of acute pancreatitis in CER-AP, TLCS-AP and FAEE-AP. The models of AP are abbreviated on the graph as C for CER-AP, T for TLCS-AP and F for FAEE-AP. The bars indicate the mean values ± the standard errors. In all parts of this figure dark, bars represent the treatment groups, while the light bars represent control (sham) groups (see Materials and Methods Section and text boxes above the bars specifying the color coding). There were no statistically significant differences between the control/sham groups of MCU−/− and MCU+/+ mice in the values of biochemical parameters for any type of control/sham experiments (p > 0.05). The measured values of the biochemical parameters for all treatment groups were significantly different (p < 0.05) from the values for the corresponding control (sham) groups. The biochemical markers reflecting the severity of experimental AP are: (A) serum amylase; (B) pancreatic trypsin activity; (C) serum IL-6; (D) pancreatic myeloperoxidase activity; and (E) lung myeloperoxidase activity. The p values for comparison between MCU−/− and MCU+/+ mice in AP models are indicated above the corresponding bars. In this part of the study, 12 MCU−/− and 13 MCU+/+ mice were used for the CER-AP (with exception of pancreatic trypsin measurements for CER-AP, which were recorded on 7 MCU−/− and 7 MCU+/+); 7 MCU−/− and 10 MCU+/+ for the TLCS AP; and 8 MCU−/− and 6 MCU+/+ for the FAEE-AP.

