Figure 3.
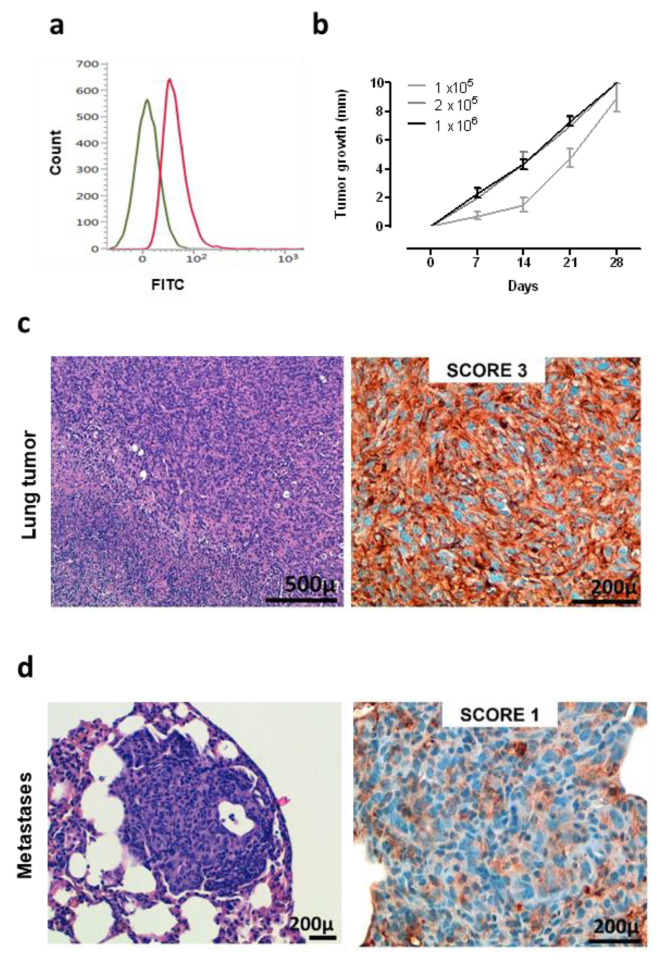
Characterization of KL-ROS1 cell line. (a) Representative cytofluorimetric analysis of anti-ROS1 (D4D6) (red line) or control unrelated IgG isotype Ab (green line) staining on KL-ROS1 cells. (b) Graph showing the tumor growth of KL-ROS1 cells injected subcutaneously in wt mice at different doses. Data are expressed as mean tumor diameters ± SD for each experimental group (N = 3–5 mice). (c,d) Representative H&E (left panels) and IHC staining for the ROS1 protein (right panels) of (c) an explanted 10 mm mean diameter KL-ROS1-derived tumor and (d) a spontaneous KL-ROS1-derived lung metastases. N = 4 mice were analyzed.

