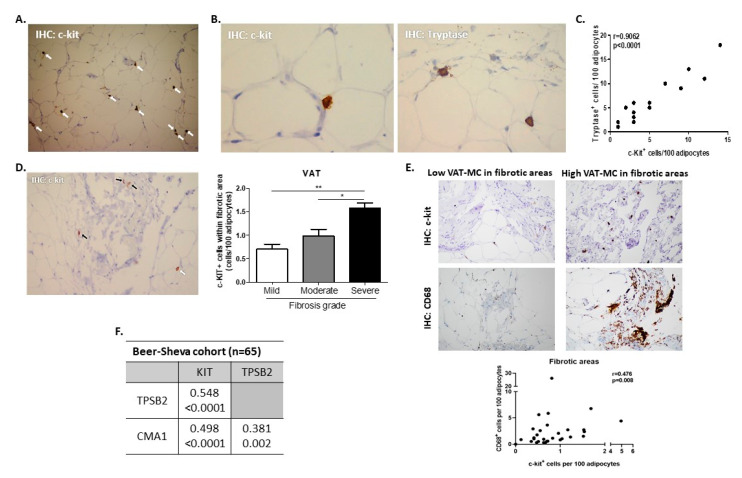
Figure 1.
Identification of human visceral (omental) adipose tissue mast cells (AT MC). AT stained for c-KIT Proto-Oncogene Receptor Tyrosine Kinase (C-Kit+, white arrows) with (A) ×100 and (B) ×400 magnification (left), or stained for tryptase+ cells ×400 (B, right). (C) Spearman’s correlation between %C-Kit+ and %tryptase+ cells (percentage being per 100 adipocytes) in serial AT sections (n = 14). (D) C-Kit+ is discernable both within fibrotic areas (black arrows) and around adipocytes (white arrow), and bar graph—the number of C-Kit+ cells in sections rated by clinical pathologists (co-authors YD and RSL) as exhibiting mild, moderate, or severe degree of fibrosis. (E) Representative histological sections from two representative patients—one with low and the second with high MC in fibrotic areas within VAT, stained for either C-Kit (MC) or CD68 (macrophages). Graph below depicts Spearman’s correlation between %C-Kit+ and %CD68+ cells (i.e., macrophages, percentage being per 100 adipocytes) in serial VAT sections within the fibrotic areas, n = 30. (F) Spearman’s intercorrelations (n = 65) between VAT MC-related genes (KIT, TPSB2, and CMA1). In each correlation, the upper line indicates r(ρ) value and lower line—p-value.

