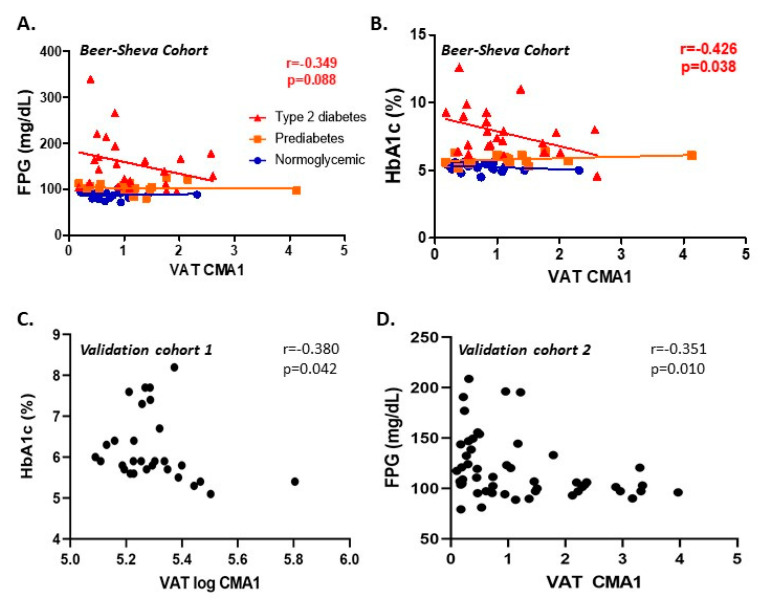
Figure 3.
Associations between VAT CMA1 gene expression and glycemic parameters in the Beer–Sheva and Leipzig independent cohorts. Spearman’s associations between VAT CMA1 gene expression and FPG (A) or HbA1c (B) among the Beer–Sheva cohort (n = 65, all with body mass index ≥ 30 kg/m2), stratified into those with normal glucose homeostasis (normoglycemic, blue circle), prediabetes (orange square), or type 2 diabetes (red triangle). r denotes Spearman’s rank correlation coefficient (Rho, ρ) among participants with type 2 diabetes. (C) Spearman’s rank correlation between log-transformed CMA1 expression in VAT assessed by microarray and HbA1c in the Leipzig validation cohort 1 (n = 32, all with BMI ≥ 30 kg/m2). (D) Spearman’s rank correlation between CMA1 expression in VAT and FPG in Leipzig validation cohort 2 (n = 56, all with BMI ≥ 30 kg/m2).

