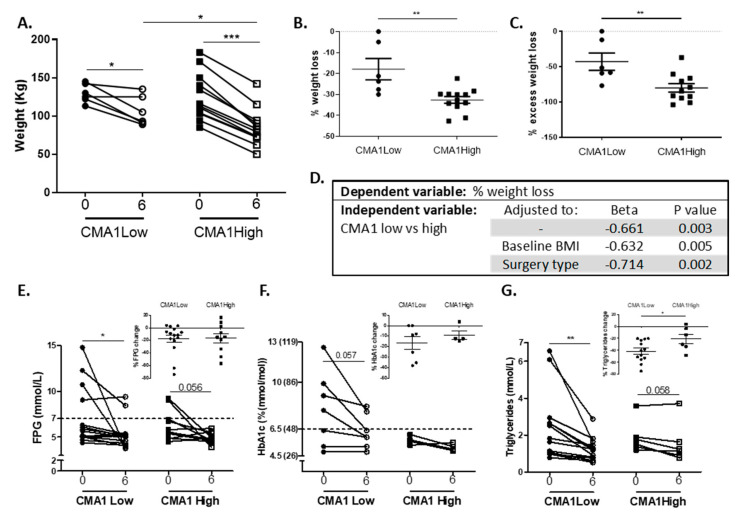
Figure 5.
Six months postoperative weight reduction and metabolic changes comparison between people with VAT CMA1 high or CMA1 low. (A) Body weight change between operation day (0) and 6 months post-surgery in persons with low expression (i.e., below median) of CMA1 (n = 6, circles) or high CMA1 mRNA levels (n = 12, squares). Percentage of weight loss (B) from preoperative weight and of excess weight loss six months following bariatric surgery (C). A paired t-test was used to compare between pre-operation (0) and 6 months post-surgery (6). A Mann–Whitney non-parametric test was performed in order to compare means between CMA1 low and CMA1 high. * p < 0.05, ** p < 0.01. (D) Multi-variant model for association between VAT CMA1 groups and 6 months weight changes as dependent variable, adjusted to baseline BMI and surgery type. Change in FPG (E), HbA1c (F), and triglycerides (G) between operation day (0) and 6 months post-surgery in persons with low expression CMA1 or high CMA1 mRNA levels. The percentage of change in FPG, HbA1c, and triglycerides (insets). Values are expressed as mean ± standard error of the mean (SEM).

