Figure 1.
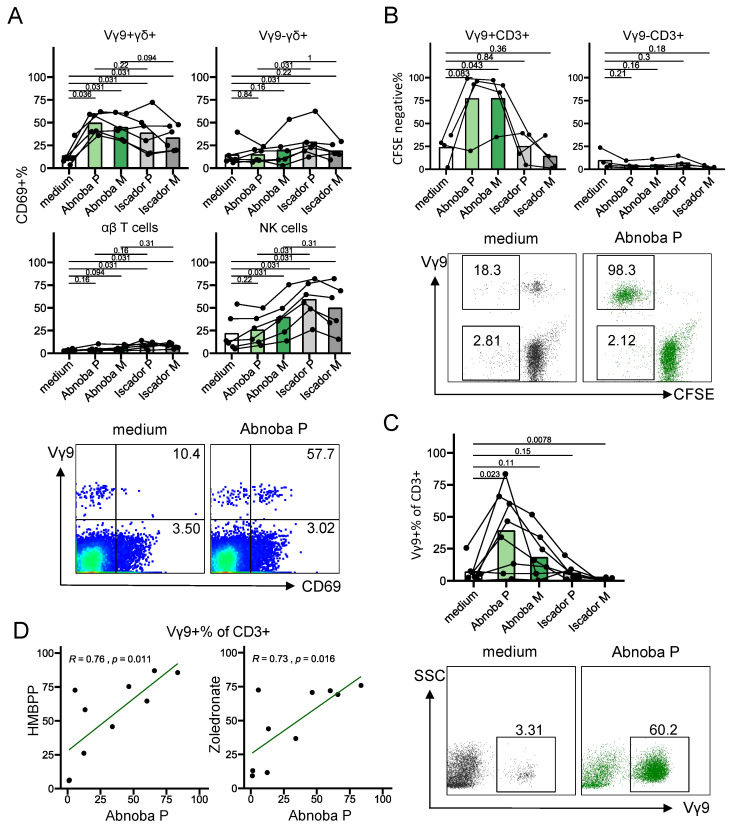
AbnobaViscum but not Iscador mistletoe extracts induce specific expansion of Vγ9Vδ2 T cells. (A) Percentage of CD69 expression on different cell types after stimulation with different mistletoe extracts for 1 day. Upper left: Vγ9+ γδ T cells (CD3+γδ+Vγ9+); upper right: Vγ9− γδ T cells (CD3+γδ+Vγ9−); lower left: αβ T cells (CD3+γδ−); lower right: natural killer (NK) cells (CD3−CD56+). Lines connect the same subjects (n = 6), bars indicate mean values. Values on the graphs indicate p values (obtained with the Wilcoxon signed-rank test). Bottom panels show representative flow cytometry plots (gated on CD3+ T cells), numbers indicate percentages of CD69+ cells, expressed as a percentage of Vγ9+CD3+ cells (top) and as a percentage of Vγ9−CD3+ cells (bottom). (B) Percentage of CFSE-negative Vγ9+ T cells (CD3+Vγ9+, upper left) and Vγ9− T cells (CD3+Vγ9−, upper right) after stimulation for 5 days with different mistletoe extracts. Lines connect the same subjects (n = 4), bars indicate mean values. Values on the graphs indicate p values (obtained with the paired T-test). Bottom panels show representative flow cytometry plots (gated on CD3+ T cells), numbers indicate percentages of CFSE-negative cells, expressed as a percentage of Vγ9+CD3+ (top) and as a percentage of Vγ9−CD3+ (bottom). (C) Percentage of Vγ9+ cells (of total CD3+ T cells) after stimulated with different mistletoe extracts for 7 days. Lines connect the same subjects (n = 8), bars indicate mean values. Values on the graphs indicate p values (obtained with the Wilcoxon signed-rank test). Bottom panels show representative flow cytometry plots (gated on CD3+ T cells), numbers indicate percentages of positive cells in the indicated gates. (D) Correlation between AbnobaViscum P- and HMBPP-, and zoledronate-induced expansion (7 days). Each dot represents one subject (n = 10).

