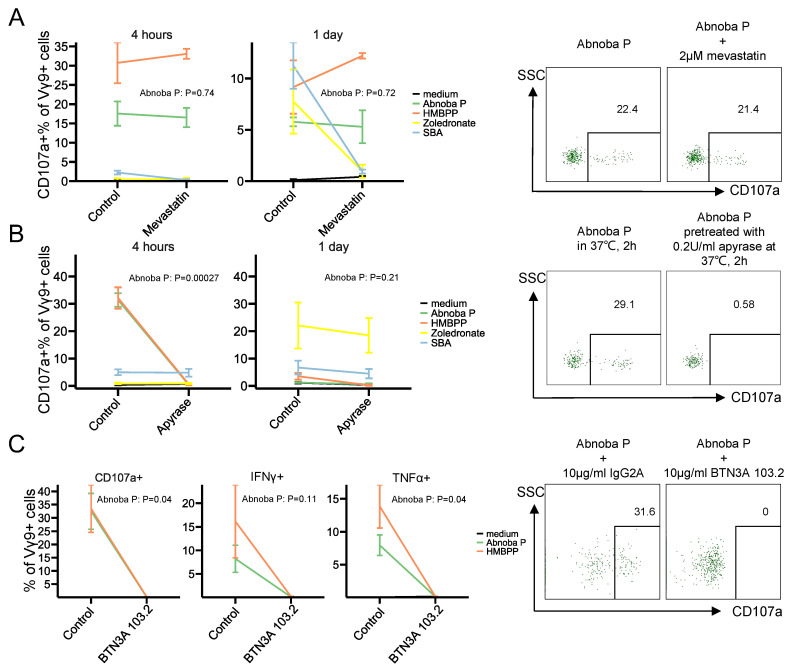
Figure 3.
AbnobaViscum stimulation of Vγ9Vδ2 T cells is direct and BTN3A-dependent. (A) CD107a expression on Vγ9+ T cells upon mevastatin treatment within each stimulation. Lines connect the mean values between control and mevastatin treatment within the same stimulation, error bars show mean±sem (n = 3). Representative flow cytometry plots after 4 h stimulation are on the right of the graphs (gate on CD3+Vγ9+ T cells). (B) CD107a expression on Vγ9+ T cells upon apyrase treatment within each stimulation. Lines connect the mean values between control and apyrase treatment within the same stimulation, error bars show mean±sem (n = 5 for 4 h, n = 3 for 1 day). Representative flow cytometry plots after 4 h stimulation are on the right of the graphs (gate on CD3+Vγ9+ T cells). (C) CD107a (left), IFNγ (middle), TNFα (right) expression in Vγ9+ T cells upon blocking BTN3A within each stimulation for 4 h. Lines connect the mean values between isotype control and BTN3A 103.2 mAb within the same stimulation, error bars show mean±sem (n = 3). Representative CD107a stainings (4 h stimulation) after are on the right of the graphs (gate on CD3+Vγ9+ T cells). Values on the graphs indicate p values (obtained with paired T-test).

