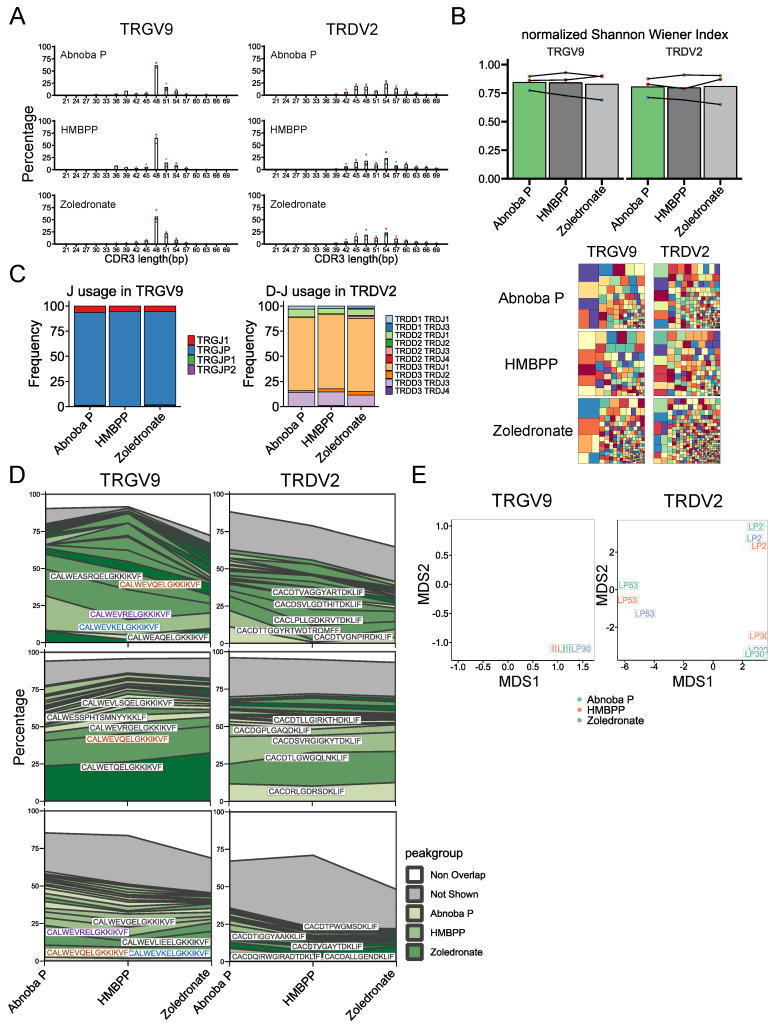
Figure 4.
The AbnobaViscum-responsive Vγ9Vδ2 TCR repertoire is similar to the phosphoantigen-responsive repertoire. (A) Distribution of CDR3 length for TRGV9- and TRDV2-containing CDR3 sequences after expansion with the indicated Vγ9Vδ2 T cell stimulators. Each color of the dots represents the same subject, bar indicates mean percentage for each CDR3 length (expressed in nucleotides). (B) Diversity of TRGV9- and TRDV2- containing CDR3. Normalized Shannon Wiener index: each color of the dots represents the same subject, lines connect each subject, bars indicate mean value. Representative treemaps for the indicated stimulators are below the graphs: each small square represents a CDR3 sequence of which the size is related to the frequency of the sequence within the repertoire within each sample (rectangle colors are chosen randomly and do not match between plots). (C) Mean J gene segment usage in TRGV9-containing CDR3 (left) and mean D-J gene segment usage in TRDV2-containing CDR3 sequences (right) (n = 3). (D) Sequence overlap between AP-, HMBPP- and zoledronate-induced expansions for TRGV9-containing CDR3 (left) and TRDV2-containing CDR3 (right). The top 20 sequences are filled with different green shades, the remaining overlapping sequences are indicated in grey and the non-overlapping sequences are in white. Top 5 shared sequences are provided on the plots for each subject: colored sequences occur in more than one subject while black sequences indicate unique sequences. (E) Multidimensional scaling analysis of TRGV9-containing CDR3 sequences (left) and TRDV2-containing CDR3 sequences (right). Colors indicate each expansion; the subject number is indicated within each small square.

