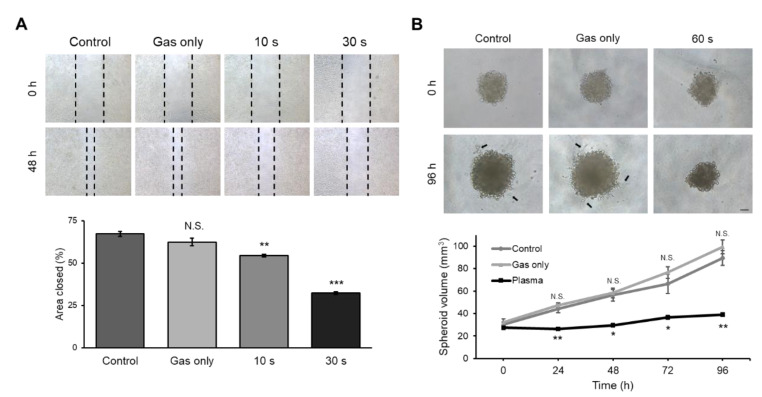
Figure 5.
Migration and invasion activity of D-17 cells after exposure to cold atmospheric plasma (CAP). (A) Cell migration assay. Representative images of cells before and after exposure to CAP. Magnification, 40X. Quantitative analysis of the area refilled after 48 h. The graph represents three independent experiments. Error bars represent the mean ± S.E.M. (B) Three-dimensional tumor spheroid invasion assay. Representative images of spheroids before and after exposure to CAP. Invadopodia were observed in control and gas-treated group (black arrow). Scale bar, 100 μm. Volume of the control or CAP-treated spheroids was measured and is presented as a graph. Error bars represent the mean ± S.E.M. of three replicates. * p < 0.05, ** p < 0.01, *** p < 0.001, compared to control; N.S. indicates not significant.

