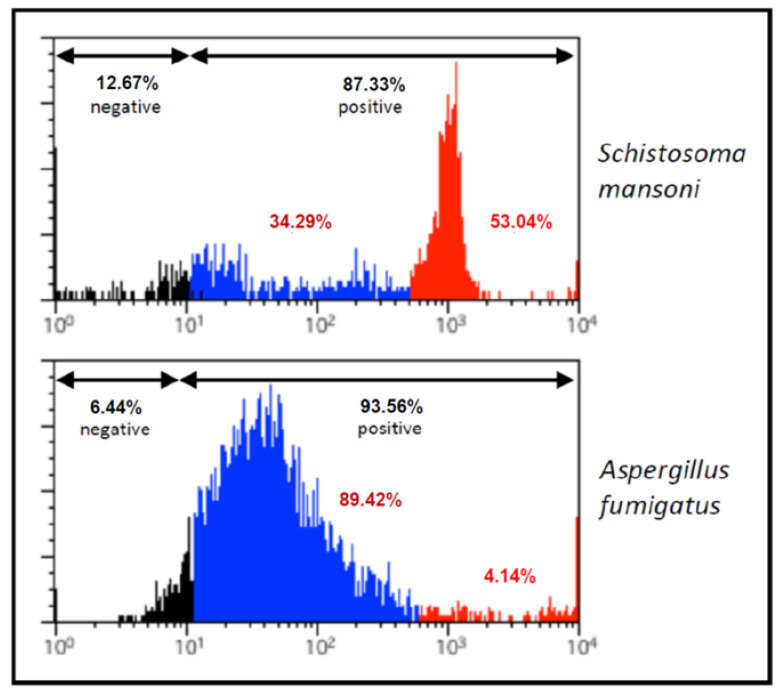
Figure 3.
Flow cytometry analysis of Schistosoma mansoni cercariae and Aspergillus fumigatus conidia counts after incubation with the α-Gal-specific monoclonal antibody M86 (primary antibody) and FITC-conjugated goat anti-mouse IgM (secondary antibody). The organisms are represented in a histogram to evaluate the relative expression of α-Gal. Unstained cells served as a negative control (black). Different proportions with low (blue) and high (red) levels of α-Gal were observed in both agents.

