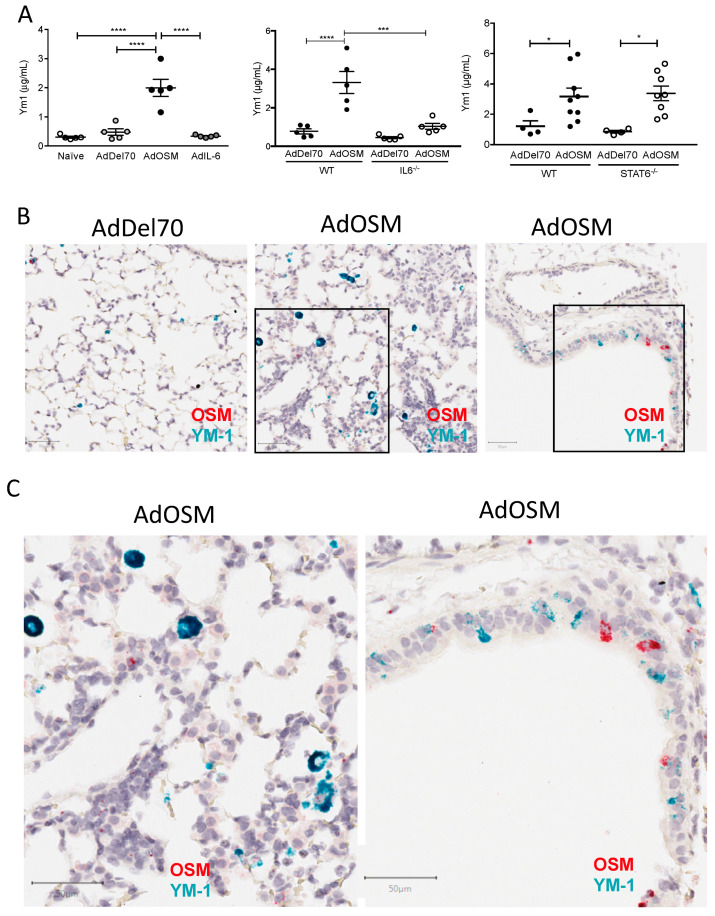
Figure 5.
Induction of total lung YM-1 protein and YM-1 mRNA in situ by AdOSM. (A) YM-1 protein levels in total lung homogenates at day 7 post-treatment with AdDel70, AdOSM or AdIL-6 in wild-type, IL-6-/- or STAT6-/- mice (as indicated) assessed by ELISA. Data are expressed as mean ± SEM (n = 4–6 mice/group). Statistical significance determined by one-way ANOVA with Tukey’s post hoc test (left panel) or by two-way ANOVA with Bonferroni’s post hoc test (right panels) (* p < 0.05, *** p < 0.001, **** p < 0.0001 between indicated groups). (B) Representative images are shown of CISH for YM-1 (green-blue) and OSM (red) in formalin-fixed paraffin-embedded lung tissue sections from mice 7 days after treatments as indicated. (C) Higher magnification images of boxed regions in B from AdOSM-treated mouse lungs of wild-type mice. Scale bars, 50 µm.

