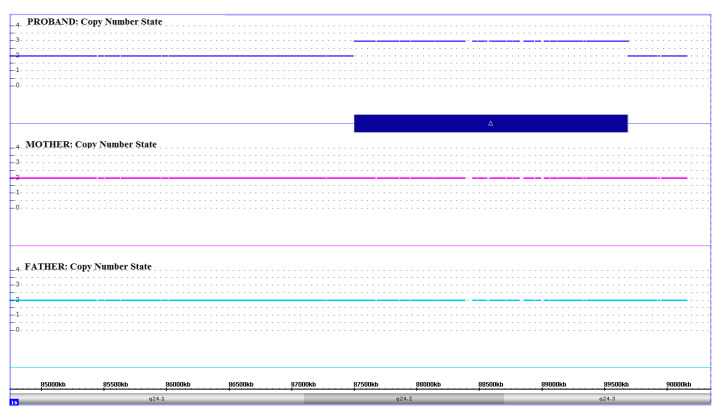
Figure 1.
Results of SNP-Array analysis in the patient and his parents. Copy number state of each probe is drawn along chromosome 16 from 85 to 90 Mb (UCSC Genome Browser, build GRCh37/hg19). The upper panel represents the copy number state of the proband, the middle panel that of the mother and the lower panel that of the father. Values of Y-axis indicate the inferred copy number according the probes intensities. Blue bar indicates the duplication identified in the patient.

