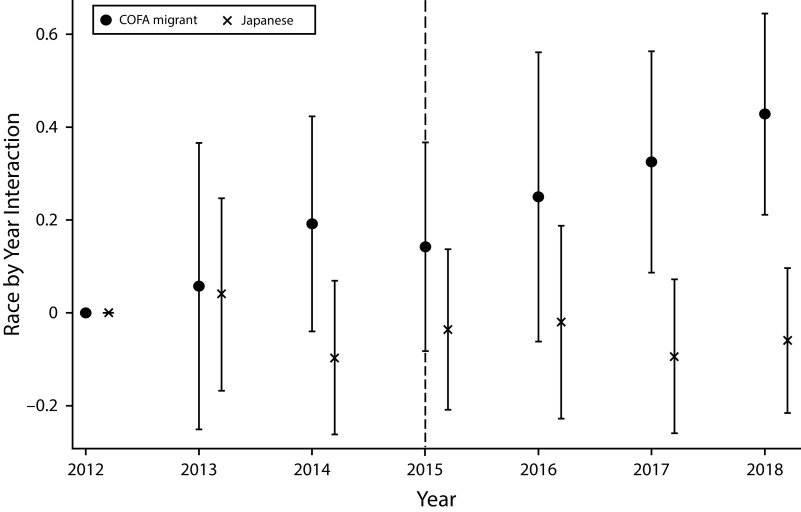
FIGURE 1—
Differences in the Change Across Racial/Ethnic Groups in Mortality Rates From March 2012 to November 2018 in Hawaii
Note. COFA = Compact of Free Association. This graph plots the coefficient estimates (and 95% confidence intervals) on COFA migrant × year and Japanese × year interactions in a regression that uses log mortality rate as the dependent variable and controls for ethnicity and year–quarter fixed effects. Sample size: 81 year–quarter–ethnicity observations. In a simple difference-in-differences model (with ethnicity and year–quarter fixed effects), the coefficient on the interaction between the COFA indicator and a post-2014 indicator was 0.21 (P = .003).

