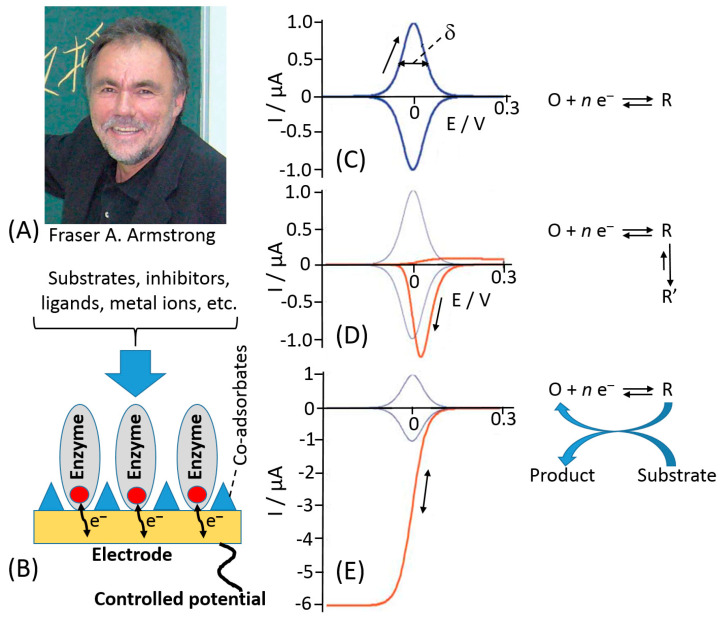
Figure 9.
(A) Fraser A. Armstrong. (B) Cartoon showing an adsorbed monolayer of protein molecules on an electrode. Electron transfer accompanying a biocatalytic process is shown schematically. (C–E) Voltammograms expected for adsorbed redox couples displaying different types of ET coupling: (C) Reversible ET. (D) Orange trace shows ET coupled to a spontaneous chemical reaction of the reduced form; on this timescale, the reverse chemical process gates electron transfer. Blue trace shows uncoupled ET for comparison. (E) Orange trace shows ET coupled to catalytic regeneration of an oxidized form. Blue trace shows uncoupled ET. (The Armstrong photo is adopted from Wikipedia, public domain; Parts (C–E) were adopted from ref. [140] with permission.)

