Figure 5.
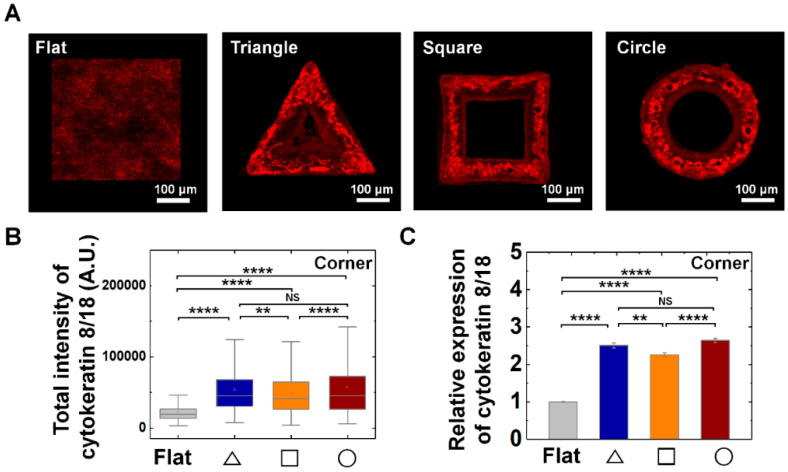
Enhanced cytokeratin 8/18 expression on convex geometric structure. (A) Representative fluorescence images of cytokeratin 8/18 (CK8/18; red) in MDCK cells on the flat and triangle, square, circle structure. (B) The box plots indicate the total intensity of CK8/18 per individual cells on corner of triangle (navy), square (orange), and circle (red) structure. The result from flat surface is plotted in gray color as a control (N = 5). (C) Mean relative CK8/18 intensity of the cells on the geometric structure compared to that on the flat surface. for flat surface and triangle, square, circle structure was 4761 and 571, 799, 1324, respectively (N = 5). Error bars in graph indicate S.E.M. One-way ANOVA with post-hoc Fisher’s LSD was used. **** p < 0.0001; ** p < 0.01; NS, non-significant.

