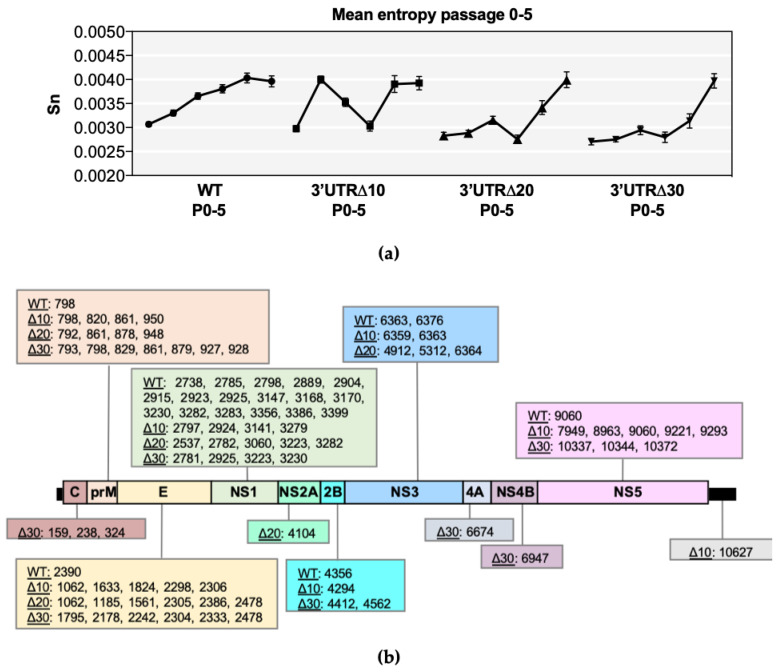
Figure 1.
Entropy analysis of each virus sequence. (a) Symbols represent the mean value (+/− standard error of the mean) of positional entropy across the genome (positions 21–10750), and lines connect P0-P5 of wild-type (WT), 3’ untranslated region (UTR)Δ10, 3’UTRΔ20, and 3’UTRΔ30. (b) Nucleotide positions with increasing entropy values across multiple passages are shown for each Zika virus (ZIKV) according to the gene region/UTR. Non-parametric statistical analysis comparing the positional entropy values of each passage demonstrated that the entropy values were significant, and this is further detailed in Supplementary Table S1.

