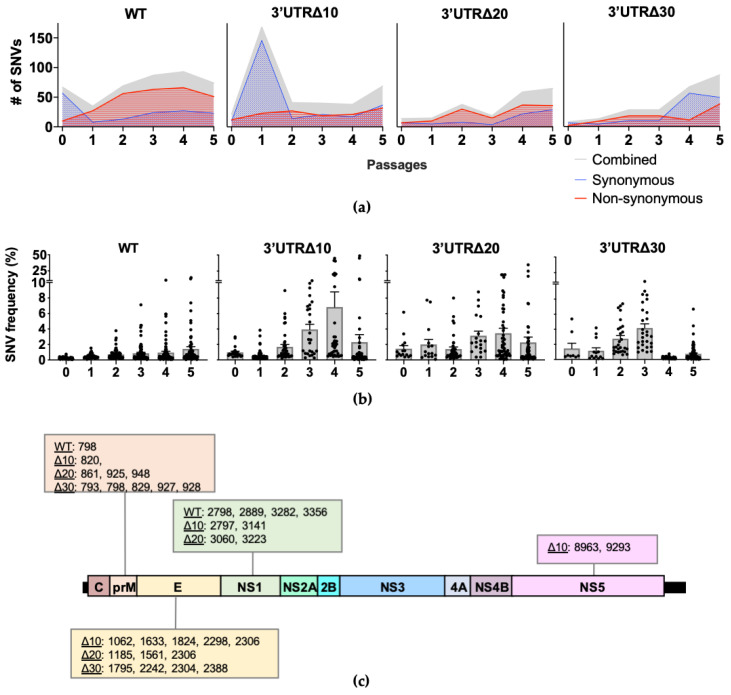
Figure 2.
Single nucleotide variant (SNV) analysis of each virus sequence. (a) The total number of SNVs per passage is depicted in gray; synonymous and non-synonymous SNVs are shown in blue with dotted fill and red with horizontal line fill, respectively. Cutoff for strand bias α = 0.05. (b) The mean frequency (+/− standard error of the mean) of SNVs is shown across passages. Each symbol represents a SNV. (c) SNVs present in multiple passages with frequencies reaching at least 5% are shown according to the genome position.

