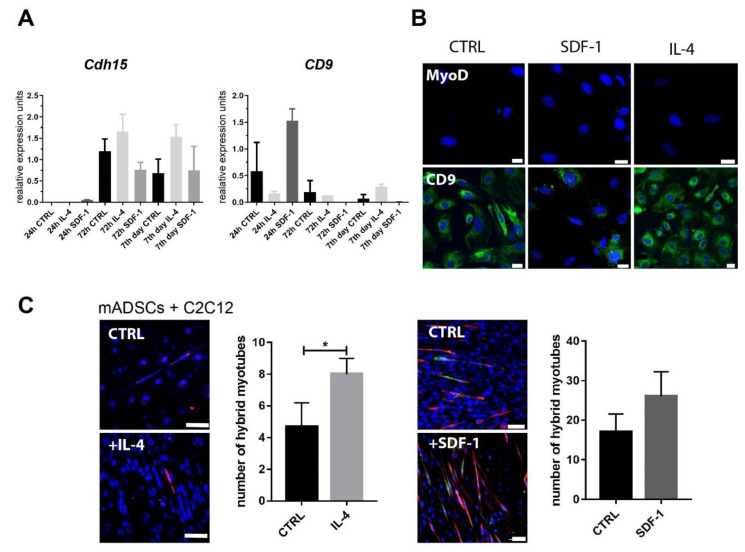
Figure 2.
Characterization of mADSCs cultured under control conditions or in the presence of IL-4 or SDF-1. (A) Analysis of the level of mRNAs encoding M-cadherin (Cdh15) and CD9. Expression was related to the levels observed in control cells at day 0 (beginning of the culture) and normalized to mRNA encoding HPRT. (B) Localization of MyoD and CD9 (green) and nuclei (blue) in mADSCs after 7 days of culture, bar = 20 µm. (C) Co-culture between mADSCs and mouse C2C12 myoblasts in the presence of IL-4 or SDF-1. Images on the left present localization of Orange CMRA (red) and nuclei (blue). Images on the right present localization of GFP (green), skMyHC (red), and nuclei (blue), bar = 50 µm. Graphs present number of hybrid myotubes detected in five randomly chosen fields of view. For each experimental group n ≥ 3. Data are presented as mean ± SD. Data have been analyzed using Student’s t-test (C); Kruskal-Wallis test (A). * p < 0.05.

