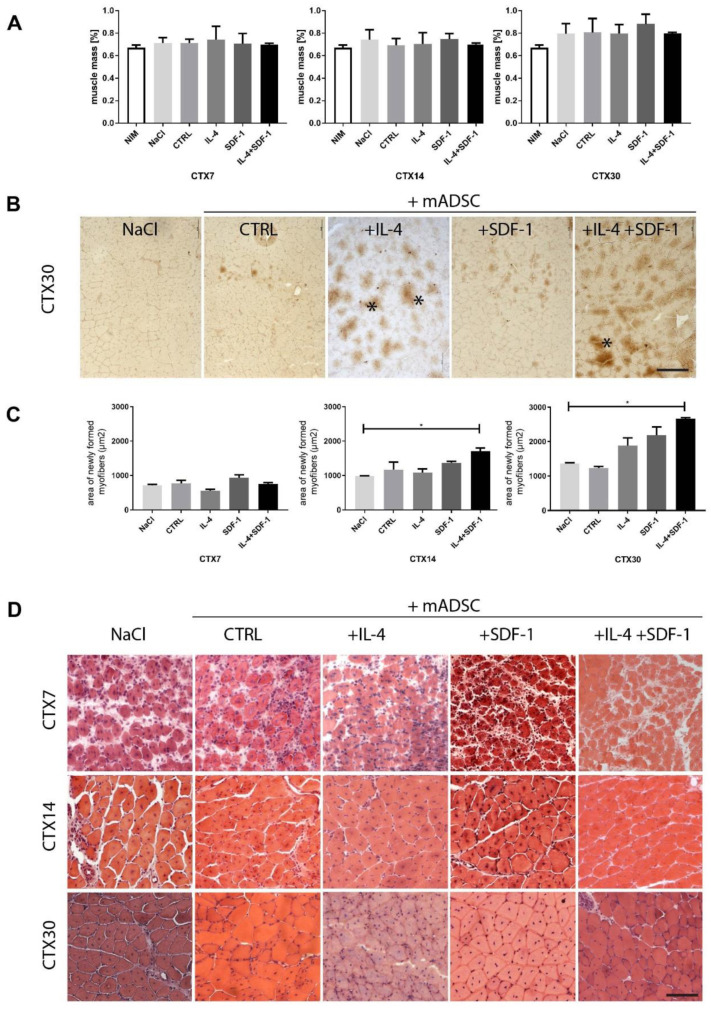
Figure 3.
Regeneration of mouse skeletal muscles which received mADSCs - control or pretreated either with IL-4, SDF-1, or IL-4 and SDF-1. (A) Weight of intact, injured control and ADSC transplanted skeletal muscles related to the weight of the mouse, analyzed at day 7, 14, and 30 of regeneration. (B) Localization of mADSCs within the skeletal muscle at day 30 of regeneration using immunodetection of GFP (brown). Stars indicate skeletal myofibers generated with the participation of mADSCs, bar = 100 µm. (C) Area of newly formed myofibers within the regenerating muscle analyzed at day 7, 14, and 30 of regeneration depending on the injected solution. (D) Histological analysis of regenerating muscle injected with NaCl or with mADSCs and analyzed at day 7, 14, and 30 of regeneration, hematoxylin & eosin staining. CTX7 - day 7; CTX14 - day 14; CTX30 - day 30 of regeneration, Bar = 100 µm. For each experimental group n ≥ 3. Data have been analyzed using Kruskal-Wallis test. * p < 0.05.

