Figure 1.
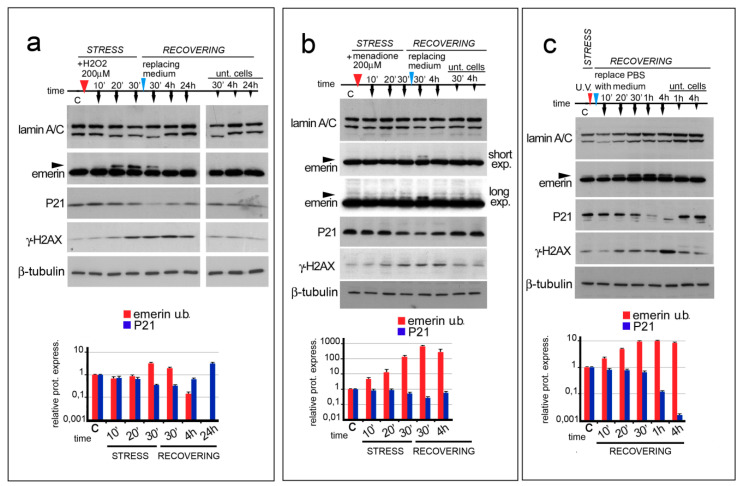
ROS generating agents affect emerin migration in SDS-PAGE. In (a–c), the time course and sample treatment is indicated over the Western blot image. Stress (STRESS) indicates the time (30 min) during which cells underwent stressing stimulus. Red arrowheads indicate H2O2 or menadione addition to the growth medium or cellular treatment with UV irradiation. Recovering (RECOVERING) indicates the time after replacement of growth medium (blue arrowheads) to remove H2O2 or menadione or PBSX1 replacement with growth medium, in the case of UV irradiation. Sample collection at different time-points is indicated by black arrows. Time (time) is indicated in minutes during the stress (10′, 20′, and 30′) and in minutes (30′) and hours (4 and 24 h) during the recovery. “C” indicates untreated cells (T0). “Unt. Cells” indicates untreated cells subjected only to growth medium replacement and harvested after 30 min, 4 h, and 24 h of recovering (30′, 4 h, and 24 h). (a) Western blotting analysis of lamin A/C, emerin, P21, gamma-H2AX, and beta-tubulin performed on protein lysates isolated from HeLa cells treated with 200 μM H2O2. Arrowhead indicates emerin upper band. (b) Western blotting analysis of lamin A/C, emerin, P21, gamma-H2AX (γ-H2AX), and β tubulin performed on protein lysates isolated from HeLa cells treated with 200 μM menadione. Two different exposures (short exp. and long exp.) of emerin immunolabeled bands are shown. Emerin upper band is indicated by arrowheads. (c) Western blotting analysis of lamin A/C, emerin, P21, gamma-H2AX (γ-H2AX), and β-tubulin performed on protein lysates isolated from HeLa cells treated with UV irradiation. Arrowhead indicates emerin upper band. In (a–c), the densitometric analysis of immunolabeled bands (logarithmic scale) is reported at the bottom of each panel. Red: upper emerin band; light blue: p21; blue: gamma-H2AX. Data are the means of three independent experiments.

