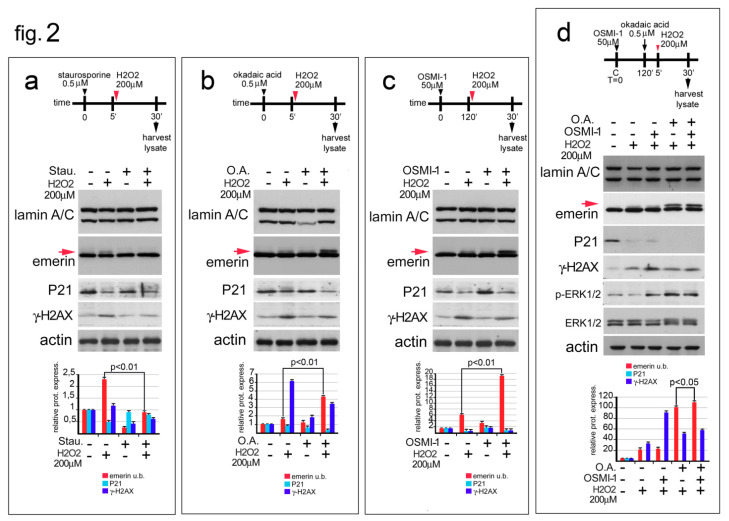
Figure 2.
Emerin phosphorylation increase during the oxidative stress response. (a) Staurosporine affects the molecular weight of emerin molecular weight during oxidative stress. The experimental workflow showing the initial treatments (black arrowhead for staurosporine, red arrowhead for H2O2), and sample harvesting (black arrow) are indicated. Western blotting performed on protein lysates isolated from untreated HeLa cells (-), HeLa cells treated with H2O2 (H2O2) (+), and HeLa cells treated with staurosporine (Stau.), alone or in combination with H2O2, are shown. Lamin A/C, emerin, P21, gamma-H2AX (γ-H2AX) and actin immunological bands are shown. The upper (phosphorylated) emerin band is indicated (emerin u.b., red arrow). (b) Okadaic Acid favors the accumulation of the upper emerin band during the oxidative stress response. The experimental workflow showing start of treatment, (black arrowhead for Okadaic Acid, red arrowhead for H2O2), and sample collection (black harrow) are indicated. Western blotting was performed on protein lysates isolated from untreated HeLa or HeLa cells treated with H2O2 (H2O2) and Okadaic Acid (O.A.), either alone or in combination as shown. Lamin A/C, emerin, p21, gamma-H2AX (γ-H2AX), and actin immunoblotted bands are shown. Emerin phosphorylated (upper) band is indicated (emerinu.b, red arrow). (c) OSMI-1, a specific inhibitor of the O-GlcNAc transferase, affects the molecular weight of emerin during the oxidative stress response. The top of the panel shows the experimental workflow. Treatment start (black arrowhead for OSMI-1, red arrowhead for H2O2) and samples collection (black arrow) are indicated. Western blots of protein lysates isolated from untreated HeLa cells or HeLa cells treated with H2O2 (H2O2) or with OSMI-1 (OSMI-1), alone or in combination, are shown. Lamin A/C, emerin, p21, gamma-H2AX (γ-H2AX) and actin bands are shown. The red arrow indicates the upper (phosphorylated) emerin band. (d) Inhibition of both protein dephosphorylation and O-GlcNAcilation favors emerin phosphorylation during the oxidative stress response. The experimental procedure is reported. Treatment, (black arrowhead for OSMI-1, black arrow for O.A. and red arrowhead for H2O2) and sample collection are indicated. Western blotting analysis of protein lysates isolated from HeLa cells treated with H2O2 (H2O2), H2O2 plus OSMI-1, H2O2 plus O.A., or a combination of all treatments (H2O2 + O.A. + OSMI-1) is shown. Lamin A/C, emerin, P21, gamma-H2AX (γ-H2AX), and actin bands are shown. The red arrow indicates the phosphorylated emerin band. In (a–d), densitometric analysis of immunolabeled bands is reported at the bottom of the panel. Statistically significant difference (Student’s t-test), with respect to H2O2-treated cell values, is indicated. Red: emerin upper band; light blue: P21; blue: gamma-H2AX.

