Figure 3.
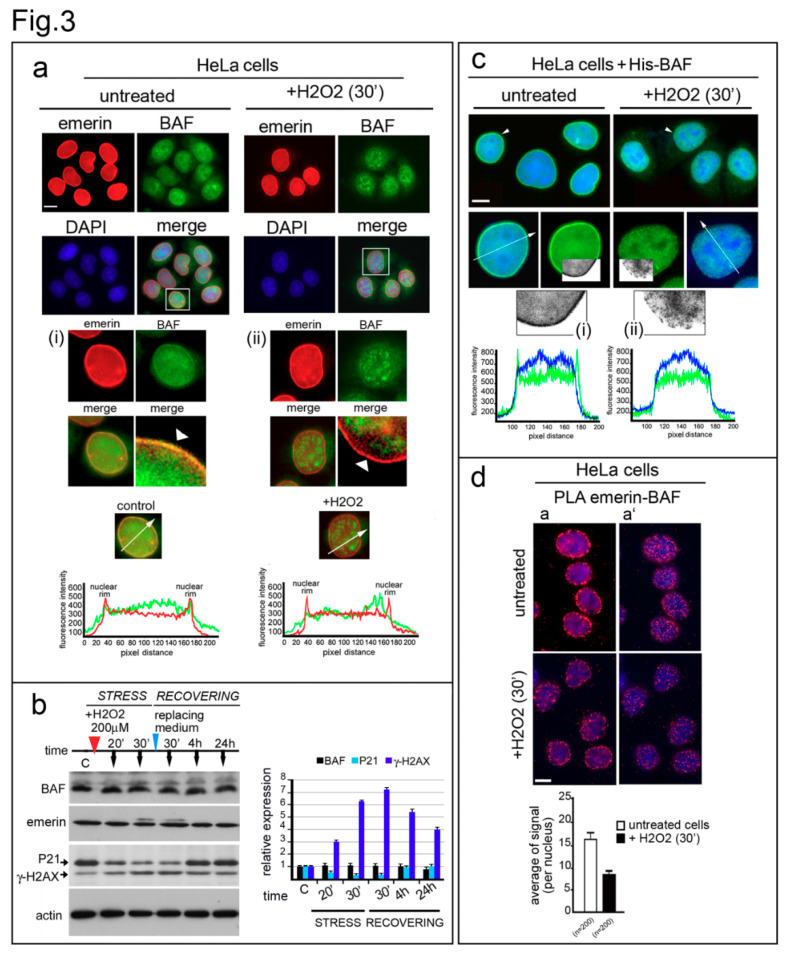
BAF nuclear localization and interaction with emerin is affected during the oxidative stress response. (a) Emerin and endogenous-BAF localization in H2O2-treated HeLa cells. Emerin (red) and endogenous-BAF (green) localization in control (untreated) and treated cells (+H2O2 (30′)). DNA was counterstained with DAPI (DAPI). Merge of fluorescence signals are shown (merge). In (i) (control) and (ii) (+H2O2), enlargements of respective nuclei are indicated by squares. BAF nuclear periphery distribution observed in untreated and treated cells is indicated by white arrowheads. Graphs indicate the fluorescence intensity profile along the white arrows. Bar: 20 μm. (b) His-tagged BAF localization in control and H2O2-treated HeLa cells. His-tag immunological staining (green) in control (untreated) and H2O2-treated cells merged with DAPI is shown. Enlarged images show nuclei (arrowheads). A portion of the nuclear His-BAF staining (green) has been converted to grayscale, and further enlarged, to better demonstrate the difference in His-BAF nuclear distribution observed in control (i) vs. treated cells (ii). The fluorescence intensity profile (white arrows) is reported (graphs). Bar: 20 μm. (c) BAF expression during the oxidative stress response. BAF, lamin A/C, emerin, P21, and gamma-H2AX (γ-H2AX) protein levels in untreated HeLa cells (-) or HeLa cells treated (+) with H2O2 (200 μM) for 30 min and allowed to recover for 24 h. Cells were harvested and lysed at the indicated times (black arrows). Actin was evaluated as a protein loading control. Densitometric analysis of immunolabeled bands is reported. (d) Emerin–BAF proximity ligation assay performed in untreated and H2O2-treated HeLa cells. Complex formation was measured using a rabbit anti-BAF antibody and a mouse anti-emerin antibody. In situ PLA is indicated by the red signal of the rolling cycle amplification products. Nuclei (blue) were counterstained with DAPI. Two different focal planes (a and a’) are shown. The graph indicates the average of positive nuclear spots per nucleus. Scale bars: 20 µm.

