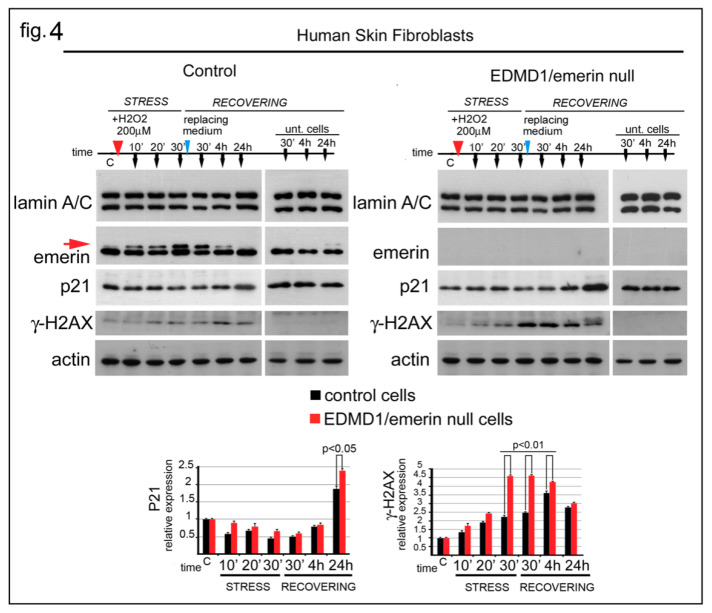
Figure 4.
Emerin depletion affects the DNA-damage response. Western blot analysis of human skin fibroblasts from a healthy donor (Control) and an EDMD1 patient (EDMD1/emerin-null) subjected to H2O2 treatment. Experimental procedure and sample collection are indicated over each Western blot panel. Stress (STRESS) indicates the time (30 min) during which cells underwent stressing stimulus. Red arrowhead indicates H2O2 addition to the growth medium. “Recovering” indicates the time after replacement of growth medium (blue arrowheads). Sample collection at the different timepoint is indicated by black arrows. Time is indicated in minutes during the stress (10′, 20′, and 30′) and in minutes (30′) and hours (4 and 24 h) during the recovery. “C” indicates untreated cells before treatment. “Unt. Cells” indicates untreated cells subjected to growth medium replacement and harvested after 30 min, 4 h and 24 h of recovering. Lamin A/C, emerin, p21, gamma-H2AX (γ-H2AX), emerin, and actin bands are shown. Densitometric analysis of p21 and gamma-H2AX (γ-H2AX) bands normalized to control and EDMD1 untreated cells is reported. The red arrow indicates the phosphorylated emerin band. Statistical differences (Student’s t-test) between control and treated EDMD1 cells are indicated.

