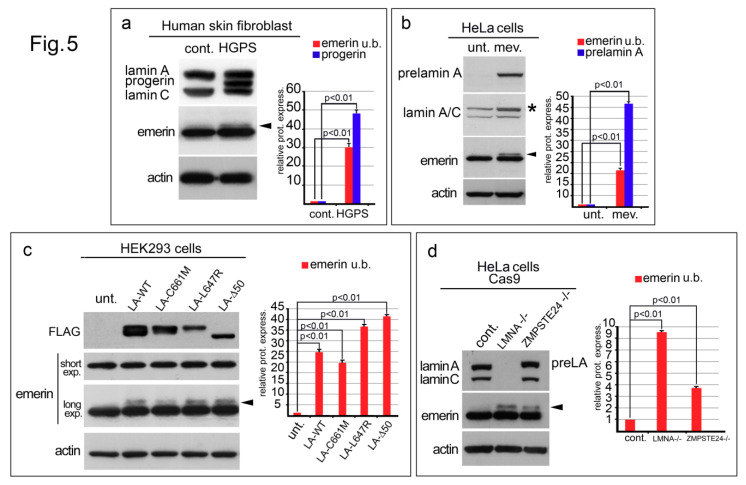
Figure 5.
Prelamin A processing defects or lamin A/C silencing affect emerin expression. (a) Western blotting of human skin fibroblasts from a healthy donor (cont.) and HGPS patient (HGPS). Lamin A, progerin and lamin C were detected using a goat polyclonal anti-lamin A/C antibody. Emerin staining at predicted molecular weight is observed in control cells while in HGPS cells an additional emerin band is detected (arrowhead). (b) Total lysates from untreated HeLa cells (unt.) or HeLa cells treated with mevinolin (mev.) were subjected to prelamin A (prelamin A), lamin A/C, and emerin immunoblotting. Prelamin A band, detected by the anti-lamin A/C antibody is indicated by an asterisk (*). The upper (phosphorylated) emerin band observed in mevinolin treated cells is indicated by an arrowhead. (c) Emerin detection in HEK293 cells transiently expressing Flag-tagged prelamin A constructs. Total lysates of untransfected (unt.) HEK293 cells or HEK293 cells expressing wild-type prelamin A (LA-WT), non-farnesylated prelamin A (LA-C661M), farnesylatedand carboxymethylated prelamin A (LA-L647R), or progerin (LA-∆50) were probed with antibodies specific for FLAG (FLAG) and emerin (two different exposure, short and long, are shown). The upper (phosphorylated) emerin band is indicated by an arrowhead. (d) Total lysates from untreated HeLa cells (cont.) or HeLa cells subjected to CRISPR/Cas9 genome editing for the LMNA (LMNA −/−) or ZMPSTE24 (ZMPSTE24 −/−) gene deletion were probed with antibodies specific for lamin A/C and emerin. The upper (phosphorylated) emerin band is indicated by an arrowhead. In (a–d), actin was evaluated as a protein loading control. The densitometric analysis of immunolabeled bands is shown. Statistical differences (Student’s t-test) between control cells and cells bearing prelamin A processing defects or depleted in lamin A/C, are indicated.

