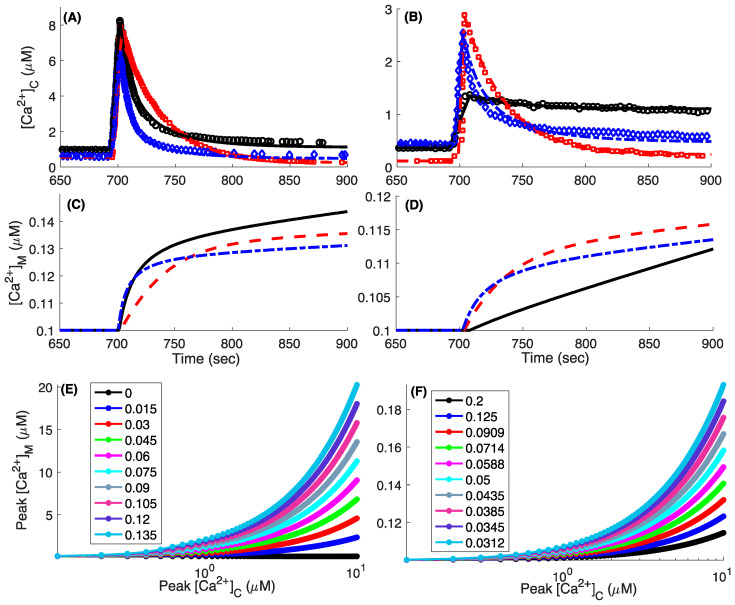
Figure 3.
Model fits to the whole-cell cytosolic Ca2+ traces observed in the cell culture experiments and the effect of mitochondrial Ca2+ buffering capacity and relative size with respect to cytoplasm on free mitochondria Ca2+. (A) [Ca2+]C in WT (spheres, solid line), MICU1 KO (squares, dashed line), MICU2 KO (diamonds, dashed-dotted line) cells. Symbols and lines represent experimental observations and model fits respectively. Cells were treated with 0.004% digitonin to permeabilize plasma membrane, 2 μM thapsigargin to block ER Ca2+ uptake, and 20 μM CGP37157 to inhibit mitochondrial Ca2+ efflux, added at t = 50, 100, and 400 s, respectively. After reaching steady state, a bolus of Ca2+ was added to the cytoplasm at ~700 s to raise [Ca2+]C to above 7 μM. (C) [Ca2+]M given by the model. Results in (B,D) are similar to (A,C) except that the bolus of Ca2+ added was smaller. Peak [Ca2+]M 300 s after the Ca2+ bolus was added as a function of maximum [Ca2+]C in WT cells as we change fm (E) and δ (F). The legends in (E,F) respectively represent the values of fm and δ used. In all simulations shown in Figure 3, a fixed mitochondrial membrane potential Δψ = −160 mV is used. Experimental data shown for comparison are from [12] (A,B).

