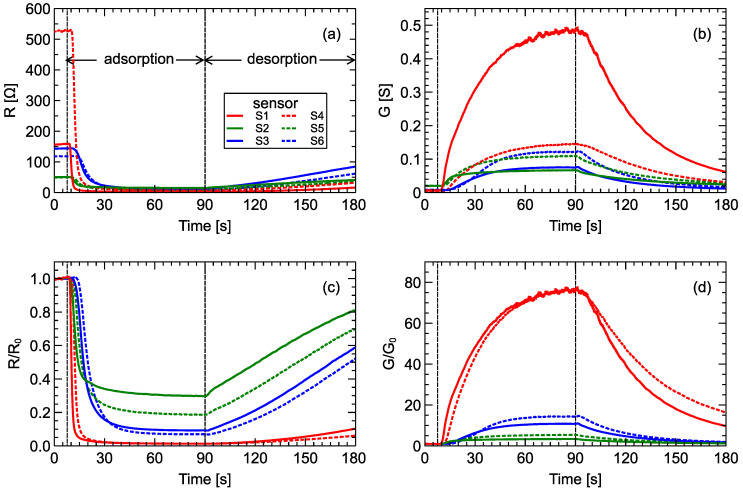
Figure 1.
Typical sensor array response: (a) sensor resistance and (b) sensor conductance. Sensor responses standardized to the baseline measurements (c) and (d) . Vertical lines indicate various phases of the measurement process: baseline collection, gas adsorption, gas desorption. To not overload charts, assignment of all lines to the sensor numbers is indicated only in chart (a); line styles are consistent in all charts. Data measured by sensor pairs of the same type are plotted using the same color with different line styles. Measurements of average-quality wine (AQ_Wine02_B04_R01) were used in this figure.

