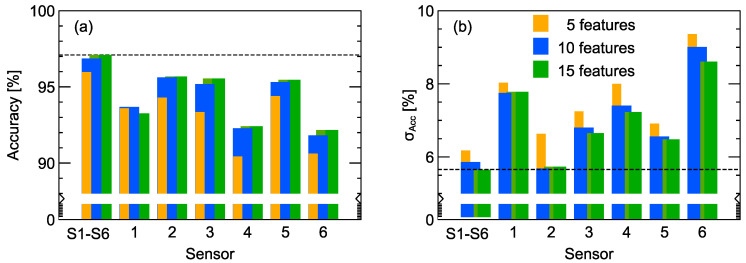
Figure 6.
Average accuracy (a) and standard deviation (b) of models trained on features extracted from all six sensor signals and from each individual sensor (1 to 6), respectively. Individual bars from left to right in each group display values obtained for 5, 10, and 15 features, respectively. A horizontal line is drawn to guide the eye and indicates the best performing model obtained with data extracted from responses of all sensors.

