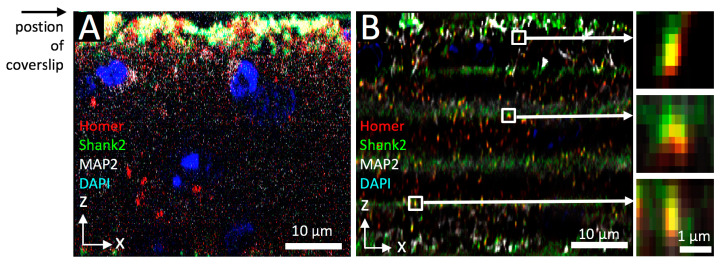
Figure 4.
Comparison of optical sectioning and confocal/deconvolution microscopy in synapse imaging of mouse brain tissue. Image stacks of mouse brain labeled to detect Homer (red), Shank2/ProSAP1 (green) and MAP2 (white) were acquired with SIOS (ApoTome) microscopy (A) or SPDM/deconvolution (B). DNA was counterstained with DAPI (blue). Images show orthogonal views of each image stack. Single accumulations of colocalized Homer and Shank2 fluorescence, likely representing PSDs, were selected (white box in B) and shown as enlarged x/z views on the left side of B.

